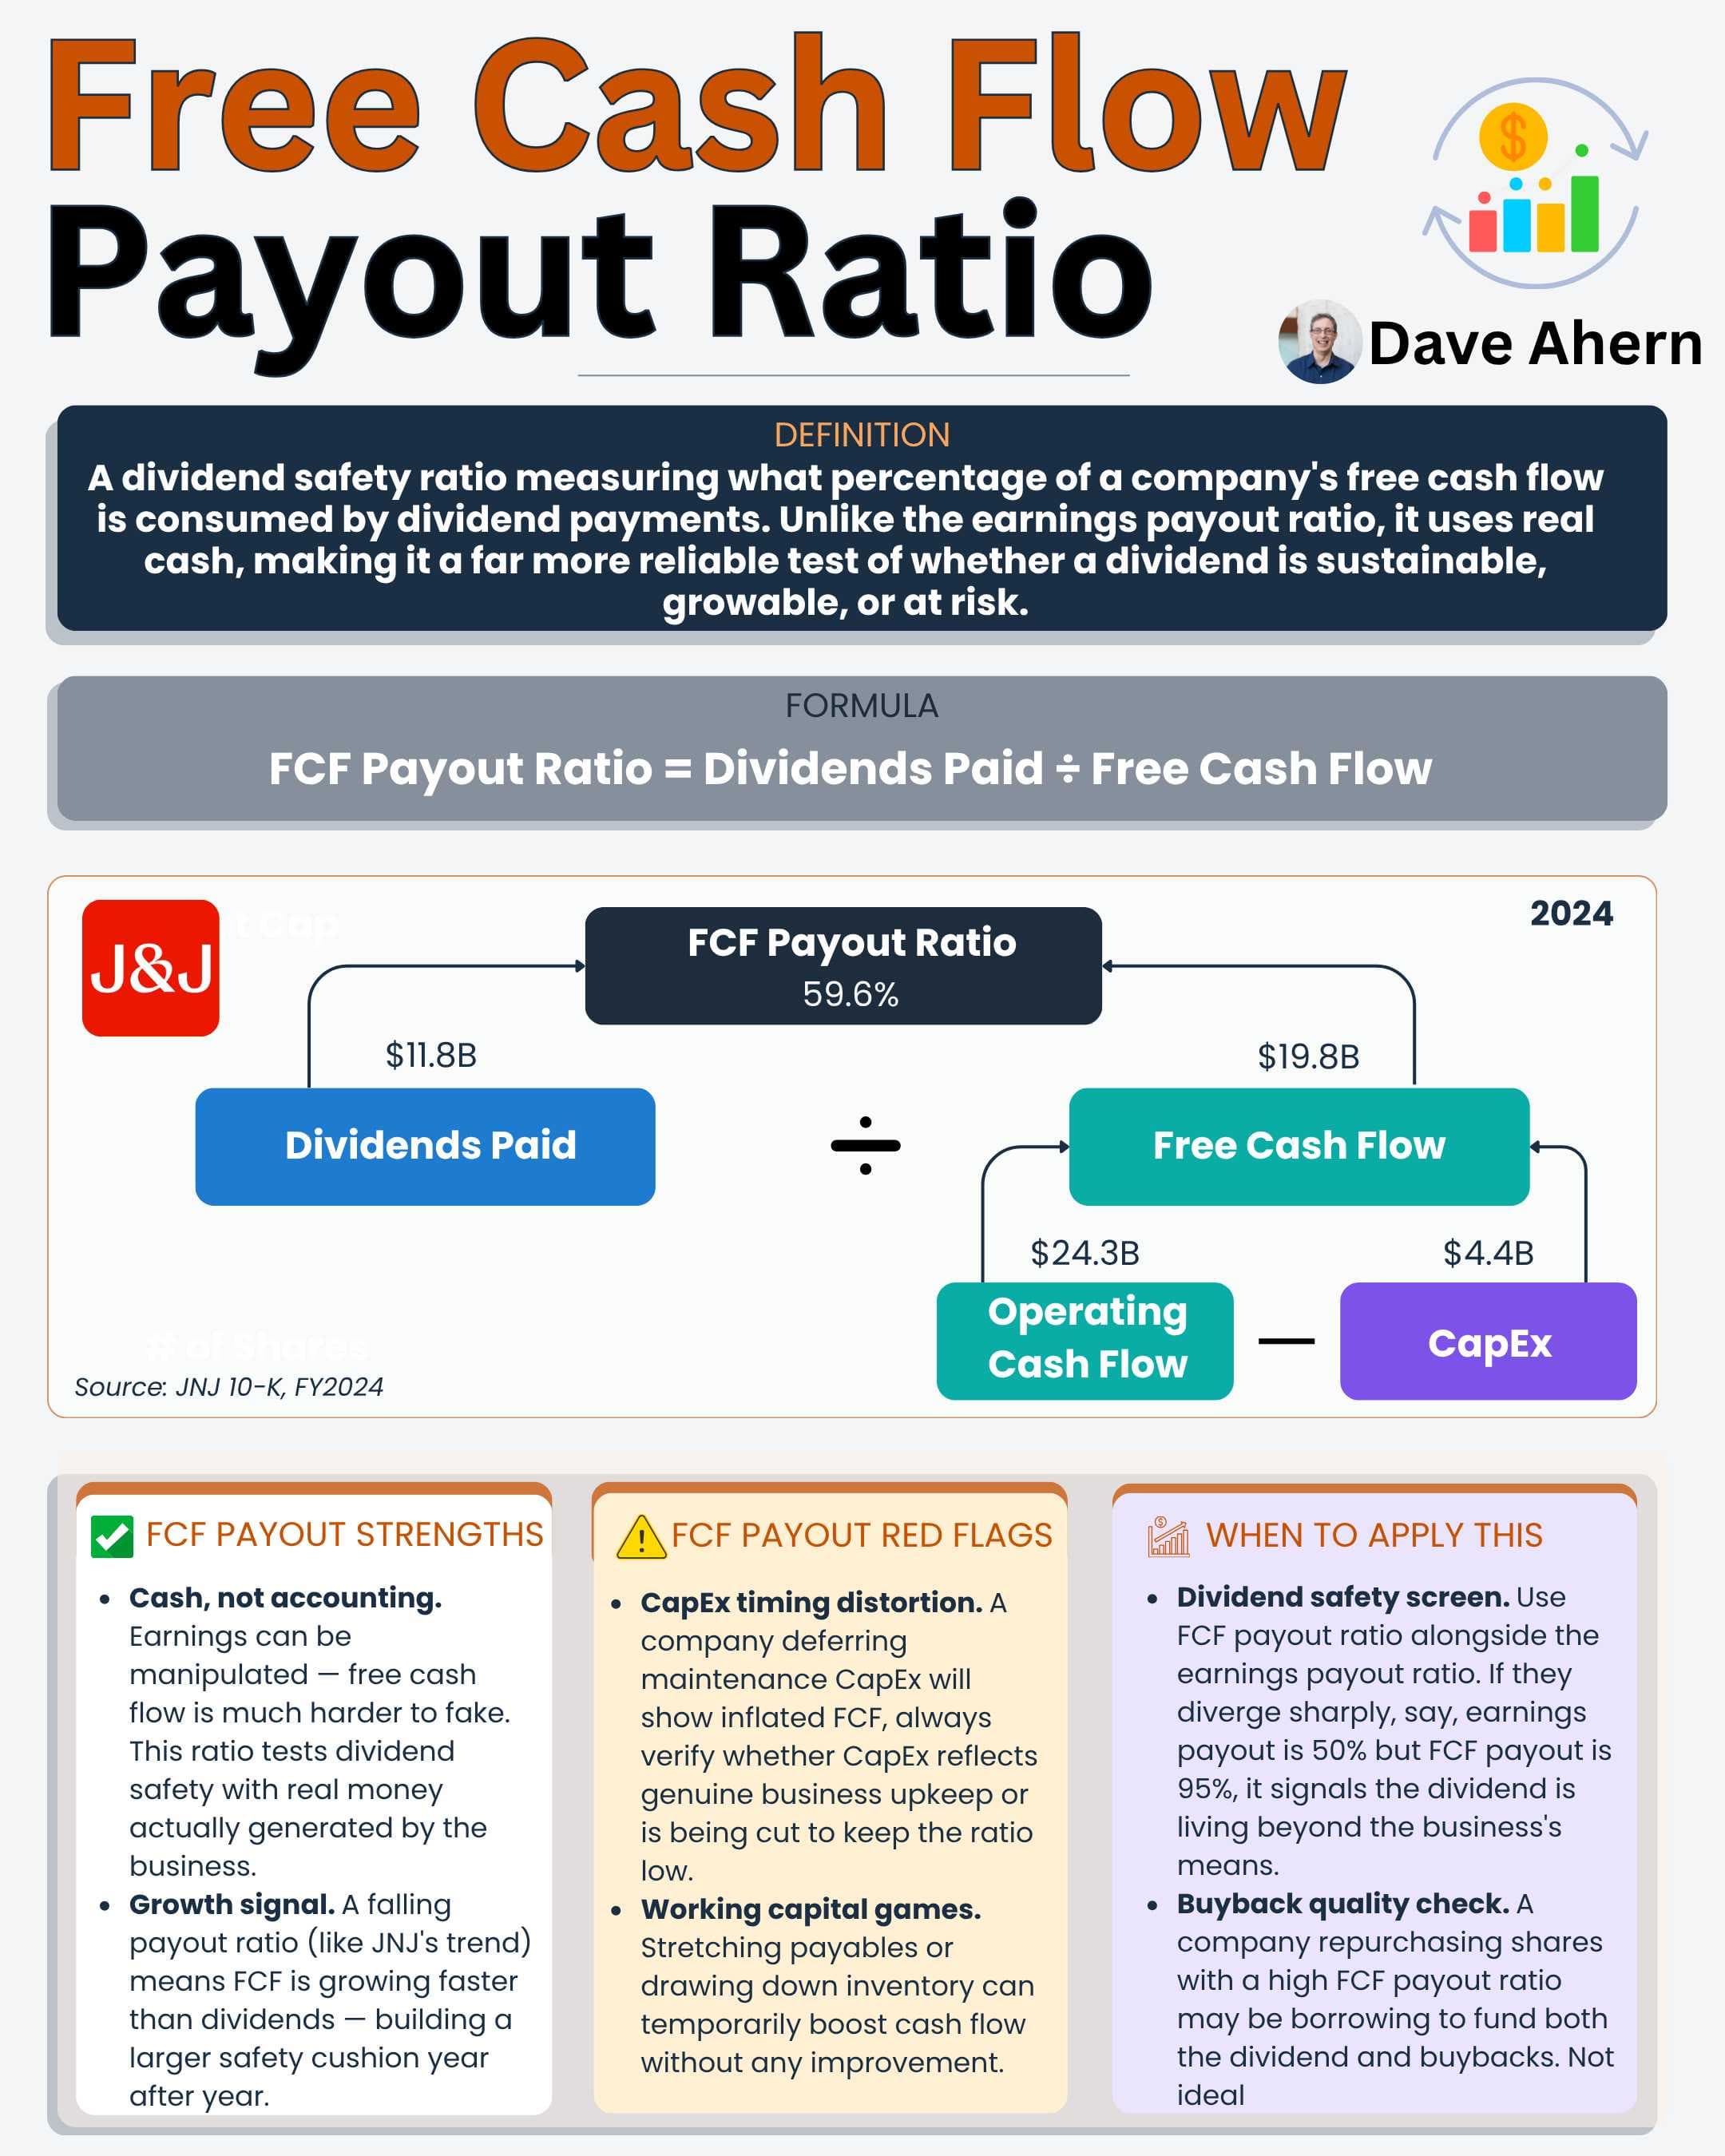
Earnings can be manipulated. Free cash flow is much harder to fake. That one distinction changes how you evaluate every dividend stock you'll ever own. There's a better way to check if a dividend is safe. It's called the Free Cash Flow Payout Ratio. Here's how it works: FCF Payout Ratio = Dividends Paid divided by Free Cash Flow Free Cash Flow is the money left after a company pays its bills and maintains its business. Actual cash, after the accounting adjustments are stripped out. Think of it like your paycheck after taxes and rent. That's what's available to spend. Johnson & Johnson is a good example. In 2024, they paid $11.8B in dividends and generated $19.8B in free cash flow. That's a 59.6% FCF payout ratio. Under 60% leaves comfortable room to keep paying and growing that dividend. Why does this matter more than the earnings payout ratio? Cash in the bank is hard to fake with accounting choices. A low and falling FCF payout ratio signals dividend growth ahead. A high FCF payout ratio is a warning sign, even if earnings look fine. One watch-out: always check if capital spending (CapEx) looks artificially low. A company cutting maintenance spending to make the ratio look better is a red flag. The FCF payout ratio tells you the truth about whether the cash is really there. What dividend metrics do you pay attention to when evaluating a stock? *** Most investors own stocks they don't understand. Learn to analyze them like a pro. Free on Substack.https://lnkd.in/enBwE7-N
490 views
0 Comments
Join the conversation with 500,000+ other investors 💸
Create an account to get access to everything Blossom has to offer!
📊 Personalized algorithm based on your investing style, experience level and interests
📈 Powerful portfolio and dividend tracking tools
👀 See what top creators and others in the community are investing in