The era of "living in the boom" is over folks.. The way majority of people think and do things is old and outdated even with most content being posted online.. Its old and outdated information... Tech changed a lot.. The world doesn't stay the same. Gotta accept it or get left behind
Yesterday - after a lot of research - I decided to do something radical. I bought more Yieldmax $MSTY . Over the past 1.5 years most have abandoned MSTY - a posterchild Ultra-Yielding NAV ERODER. BUT... has it really? Did most get MSTY all wrong? For all you DCA'ing $MSTE - have you been DCAing on the wrong $MSTR CC ETF? (Check out my pinned comment below comparing MSTY vs MSTE) https://youtu.be/344xY-5QyiY?si=7hXie7qjHEcFCV-I
What’s the most important thing you look for when researching a stock and finding a winner? What are the things that a stock must have in order for you to own it? Let me know below, i’m super curious!
I asked ChatGPT work to give me its top 10 stock buys for growth right now in the market And here’s what it gave me: 10. $GOOGL 9. $CRM 8. $NVDA 7. $SE 6. $META 5. $NOW 4. $NU 3. $AMZN 2. $UBER 1. $MELI Thoughts? Do you hold any of these? read more
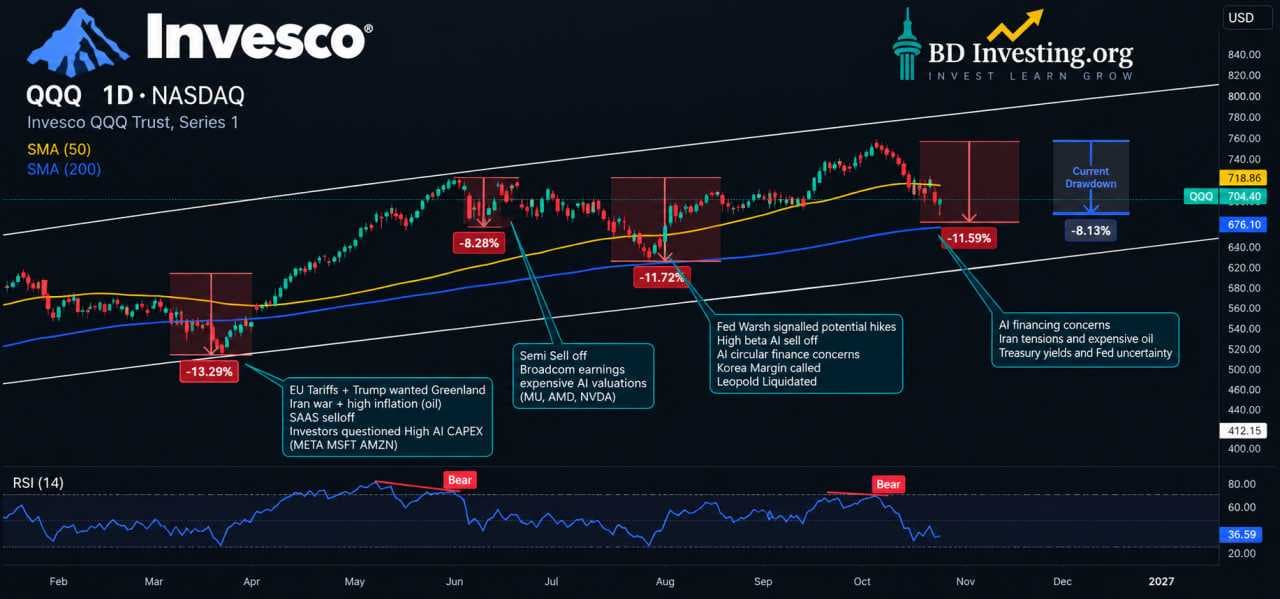
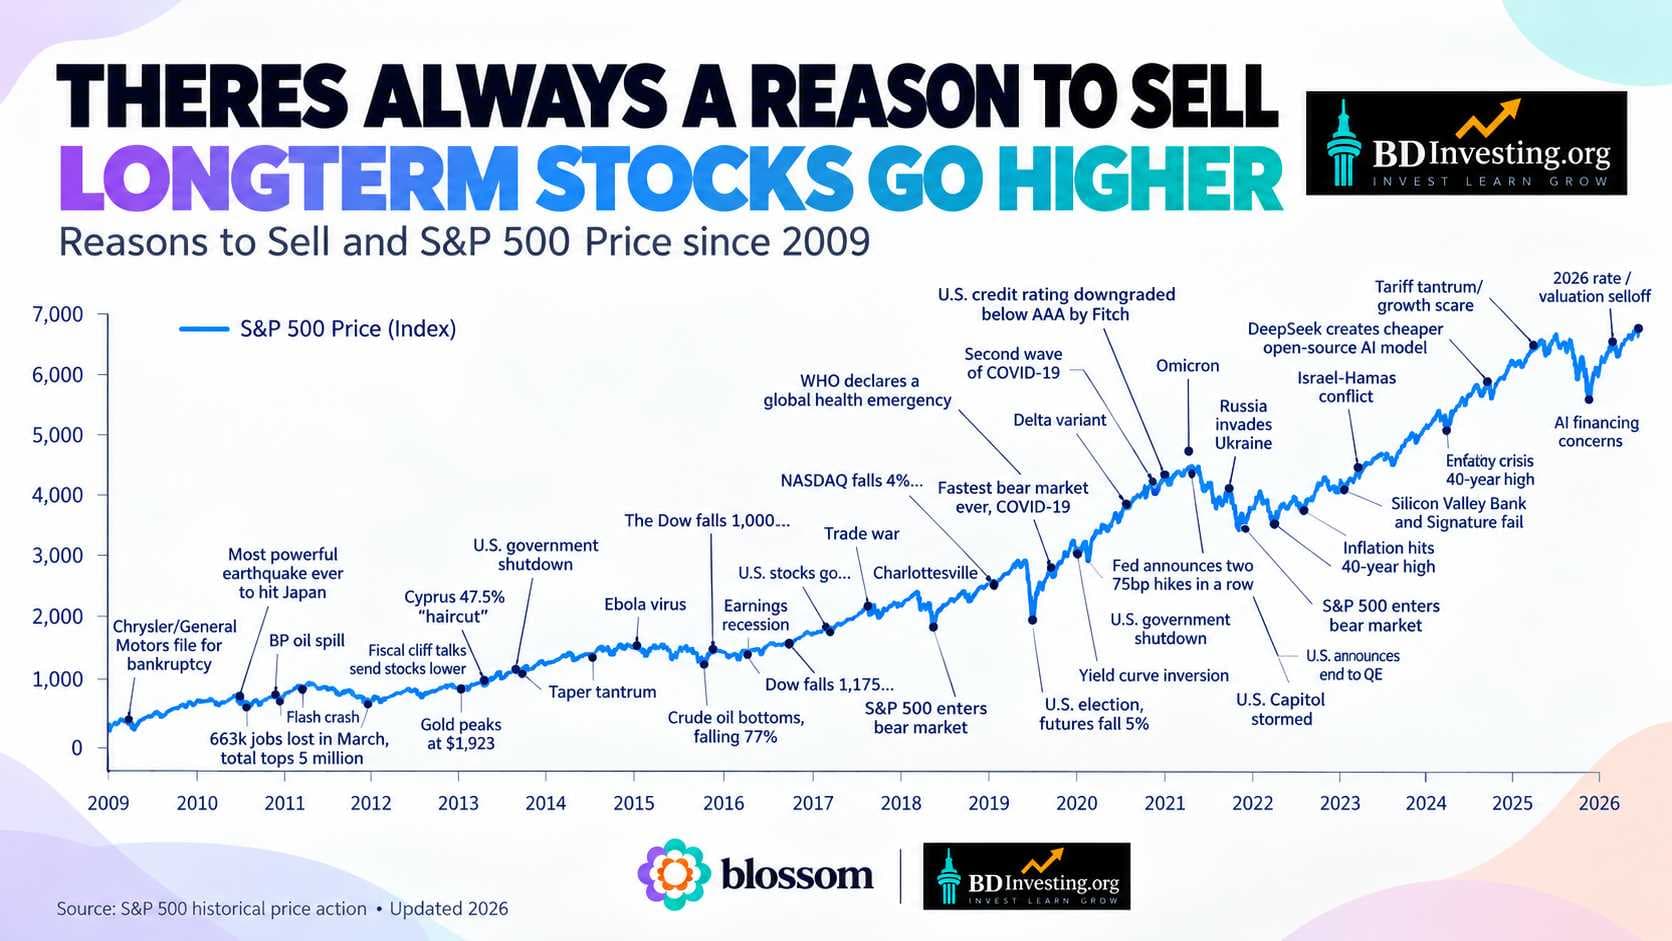
2026 has been an exhausting year for growth investors. Look at the $QQQ drawdowns this year: March: -13.29% June: -8.28% July/August: -11.72% October: -8.13% so far Notice a pattern? Almost every selloff has been driven by the same concerns. Expensive valuations, massive AI CAPEX spending, iran war ,inflation, interest rates and financing costs. Different headlines, same fears. What's frustrating is that many companies continue to report strong earnings and growth, yet their stocks keep getting punished. The fundamentals can improve while valuations compress. That's been the story of 2026. As investors remember this is the long game. Theres always a smart reason to sell, but stocks tend to go higher even with bad news. Buy the dip & HOLDread more
Trump gives a thanks to his “legendary friend” Elon Musk for pledging to give SpaceX $SPCX stock to millions of American children through Trump Accounts. I want a legendary friend.. 🥺
Fed, PCE and Big Tech: the week that could reset the AI trade This week packs a Fed decision on Wednesday, Q3 GDP and September PCE on Thursday, the ECB and the BoJ, plus earnings from Microsoft, Alphabet, SK hynix, Intel and Amazon. A hold at 3.75-4.00% is roughly 90% priced, so the tone matters more than the decision: does the door stay open to a December hike while Brent sits near $115? The 10-year ended last week near 5%. Lower yields help long-duration AI, chip and cloud names, but only if that reflects cooling inflation rather than weaker growth. Core PCE is expected near 3.1%. For the hyperscalers the bar is proof that record AI capex generates returns, not just bills. SK hynix gives the memory read: HBM shipments and Q4 pricing. My view: my 1-3 year conviction in AI infrastructure, semis and memory is intact. SMH and SOXX stay my largest positions, and this week I watch free cash flow and return on capital as closely as growth. Gradual positioning beats chasing swings. What is the bigger risk for you this week: the Fed tone or Big Tech capex?read more
One of the best parts about the Blossom community is how open everyone is sharing knowledge and experiences. To make things easier for anyone just starting their investing journey, here’s a simple glossary to help understand and simplify various terms. Common Terms: Dividend: A share of a company’s profits paid to shareholders, usually quarterly. Ex-Dividend Date: The cutoff date by which you must own a stock to receive its next dividend. ETF (Exchange-Traded Fund): A fund that holds multiple stocks or bonds, traded like a single stock. Covered Call ETF: An ETF that owns stocks and sells call options to generate extra income (higher yield, limited / capped upside). Earnings Report: A company’s quarterly financial performance summary. EPS (Earnings Per Share): A company’s profit divided by its number of shares. Market Cap: A company’s total value (share price × number of shares). ACB: The total amount you’ve paid for an investment, including the purchase price plus any fees or commissions. Book Value: The value of a company according to its financial statements (assets minus liabilities). Yield: Annual dividend as a percentage of the stock/ETF price. Liquidity: How easily an asset can be bought or sold without impacting its price. Volatility: The degree of price fluctuations in a stock or market. Index: A benchmark of stocks (e.g., S&P 500, Nasdaq, TSX). Bull Market: A period of rising stock prices and optimism. Bear Market: A period of declining stock prices and pessimism. False Breakout: When a stock’s price moves above (or below) a key level, making it look like a new trend is starting, but then quickly reverses back. P/E Ratio: Price-to-earnings ratio (stock price ÷ EPS), used to assess valuation. Blue Chip: Well-established, financially strong companies with a track record of stability. Diversification: Spreading investments across assets to reduce risk. Broker: A platform or firm that facilitates buying and selling investments. Limit Order: An order to buy/sell a stock at a specific price or better. Market Order: An order to buy/sell a stock immediately at the current market price. Bid/Ask Spread: The difference between the highest price buyers offer and the lowest price sellers accept. Dollar-Cost Averaging (DCA): Investing a fixed amount regularly to reduce the impact of market swings. Capital Gain/Loss: Profit or loss from selling an investment for more/less than its purchase price. IPO: When a company first sells shares to the public. Index Fund: A fund designed to mirror the performance of a market index. Short Selling: Selling borrowed shares, hoping to buy them back cheaper. Margin: Borrowing money from a broker to buy investments, which amplifies gains and losses. Margin Requirement: The minimum amount of your own money (equity) you must maintain in a margin account to open or keep a leveraged investment position. Margin Call: A demand from your broker to deposit more funds or sell assets because your account equity has fallen below the required margin level. Time Horizon: The length of time you plan to hold an investment before needing the money. Short horizons = more risk-sensitive, long horizons = more room to ride out volatility. Stock Split / Reverse Split: A split increases the number of shares (e.g., 2-for-1) while lowering the price per share. A reverse split reduces the number of shares (e.g., 1-for-10) while raising the price per share. Your overall value doesn’t change just the math. Long (Being Long): Buying a stock or asset because you expect the price to go up. Short (Being Short): Selling a stock you don’t own because you expect the price to go down, so you can buy it back cheaper later. TER: The total yearly cost of owning a fund, including the management fee plus other costs like administration, audits, and legal fees. MER: The annual cost that a fund charges for management (includes any leverage costs if used). Management Fee: A portion of the MER that goes directly to the fund managers for running the fund. Withholding Tax: A tax deducted on dividends/distributions from foreign investments (e.g., U.S. dividends to Canadian investors face a 15% withholding in TFSA/Non-Registered accounts). Total Returns: The full picture of an investment’s performance, including both price gains and dividends/distributions. CAGR: The average yearly growth of an investment over time. NAV: The price of one share of a fund (stock or etf) NAV Depreciation: When the fund’s share price goes down over time. Mutual Fund: A pool of money from many investors used to buy a mix of stocks, bonds, or other assets. Bond: A loan you give to a company or government, and they pay you back with interest. Asset: Anything valuable you own that can generate money. Portfolio: Your collection of investments. Option: A contract that gives you the right (but not the obligation) to buy or sell a stock at a set price. Future: A contract to buy or sell something at a set price on a future date. REIT: A company that owns real estate and pays investors income from rent. Alpha: A measure of how much better (or worse) an investment did compared to the market. Beta: A measure of how much an investment moves compared to the market. Sharpe Ratio: A way to see if returns are worth the risk taken. Hedging: Protecting your investments from risk. Rebalancing: Adjusting your portfolio back to your target mix of assets. FCF: Free Cash Flow Understanding these terms makes investing far less intimidating. If anyone feels other terms should be included, please share in the comments. I’ll update this post so we can build a complete beginner-friendly resource together! *Sorry tagged a few etfs for reach 🫣read more
Over the last 3 years, my investing journey has grown my knowledge and I then helped grow out portfolio. But that didn’t come from me just reading books or going to some finance class. This journey has connected me with so many different styles Of investing and investors. To many to name in this post. All of them bring something to the @blossom community. Moe @moementumfinance is one of those people. This interview was excellent to listen to. So many subjects covered and inspirational to myself and I hope to others. Moe is charismatic and kind and loves to talk finance. Zayla talks about paying yourself first. This resonates with me in so many ways. To me paying yourself first is fundamental to growing your wealth. But doing it while you are still living your best life Sure I don’t buy coffee because I make may own. But I love a good meal with my wife and a drink. We are still paying ourselves and living our best life. If you have some time check this video out. Tell us do you pay yourself first. If so share with us your philosophy https://youtu.be/hiUF2bQvs1Y?si=T_HaTyWYy0imkWzK read more
When I was young, I chased money, I thought about wealth in terms of numbers. Growing my portfolio, reaching milestones, and getting closer to financial independence. But recently.... life has a way of reminding you what truly matters. I spend years building wealth for the family, chasing the next milestone, and working towards financial freedom. But at the end of the day, what good is financial freedom if you forget what you're working so hard for... I cant stress it enough, spend time with family the time we spend together, and being there for the moments that matter most. Money is simply a tool to buy back our time and create more freedom for the people we love. i gotta admit, Ive been so caught up in building my future sometimes that I forget to enjoy the present. Having my wife, my 2 healthy kiddos, enough money to travel, have food on the table, pay all our bills, roof over our heads, thats real wealth. ❤️
With $SNDK earnings coming up and a forward P/E of 21, current P/E of only 17, what does everyone think, is it or other memory stocks a buy right now? Recent price targets in the $2000 range, along with $MU having an average target of $1600 show analysts expect huge moves out of both of them again over the next year. Since this sector is highly cyclical I want to hear some thoughts from people on whether they are a buy again. If not, why? I traded $MU and $WDC earlier in the year but the volatility was too much for me then, but am looking to get back on the memory chip train before they take off again. What signals do you look for to buy these stocks? Are these long holds? Quick trades? Lets hear it.read more
These aren’t rules, facts or anything definitive; just some of the many opinions I’ve built over nearly 30yrs of stock investing. Take em' or leave em', it's all good to me because they're accurate. 🤷♂️ Here goes, in no particular order. Far too many investors… … have a gambling mentality when it comes to investing. ... focus on where a stock once traded to determine 'fair value’. ... think their pain threshold for unrealized losses is far higher than reality. ... risk far too much for a potentially very small win. ... create a lot of bad habits during bull markets. ... fail to acknowledge mistakes, so they fail to learn from them. ... under-estimate how can be lost going all-in on high or no P/E growth. ... rely on 'wishful thinking' over an actual 'investment thesis'. ... ignore anything negative about their stocks due to confirmation bias. ... will jump into day trading and/or margin usage at worst possible times. ... make blindly 'buying the dip' they're primary investing strategy. ... consider bullish "what-ifs" , while ignoring bearish "what-ifs". … equate every bit of news as a catalyst, while it's just ‘business as usual’. .*. spend too much time on small positions & not enough on large positions. .*. fall prey to "how much lower can it go" thinking, and later learn A LOT! ... underestimate 'company specific risk' and invest too much in one stock. ... worry about how they rank against others instead of focusing on self. … don’t understand what ‘the market is forward looking’ truly means. ... fail to factor 'we don't know what we don't know' in investment thesis. ... confuse getting lucky with having a sound investment thesis. ... will eventually get kicked in the throat by an unexpected margin call. .*. own too many individual stocks complicating things for no reason. … don’t spend enough time trying to break their bullish investment thesis. … scream "manipulation", when wrong about their favorite stock. ... spend too much time on social media telling others their stocks are best. ... think 'time in the market' guarantees profits, which isn't true for stocks. ... fall for recency bias when projecting future returns. … think they know more about a stock/company, than they actually do. ... sell their winners early and hold their losers indefinitely. ... willingly pay high expenses on ETFs that don't deliver. .*. happily DCA to lower cost basis, but won't do it to raise cost basis. ... turn a blind eye to dilution from rampant share issuance. ... ignore importance of long-term diversification. ... assume any ETF or mutual fund is safer than a stock. .*. get caught up believing the hype of a highly speculative stock. ... don't bother researching balance sheet & other key metrics.. ... under-estimate what's needed to retire 'comfortably', incl. fire/coast fire. .*. over-estimate what's needed to retire 'comfortably' (opposite of above). ... are far too quick to give advice while being ill-equipped to do so. ... over-estimate their true returns by failing to offset deposits. ... get cocky during bear markets & ultimately lose years of gains because of it. I think I've shared something similar to this in the past, so if I'm being honest, not really sure why I'm sharing... As with most of my posts, it's likely driven by what I'm seeing in my Blossom feed. And full disclosure, I've been guilty of a few of these (.*.) myself. Maybe you're guilty of some too. ** Wanted or not, I'll add to this list as more come to mind. **read more
Happy Friday, Blossom! 🌸 I went back to the gym after 5 months! 🏋️♀️ When life flips 180 degrees, it's easy for your routines to fall apart. This week was rough, and the market was red too 😂 ( I did buy the dip to the extent I could though!!) but getting back to something I enjoy reminded me that investing in ourselves goes beyond our finances! As I adjust to this new chapter, it feels good to slowly get back to the things I enjoy. My gym membership is one way I invest in myself. It's on the pricier side, and I could find a cheaper gym, but I genuinely enjoy the amenities, and it's worth paying extra for something that fits my lifestyle. We talk a lot about saving, investing, and making smart financial decisions, but sometimes we forget WHY we're doing it. For me, it's about building a comfortable future while still enjoying life today. It's treating my friends and family, taking that much-needed vacation, and spending on things that genuinely make me happy. There's a difference between being financially responsible and depriving yourself of everything you enjoy. If we cut out everything that makes life enjoyable, reaching our goals can start to feel like a chore. Don't forget to invest in yourself along the way.You deserve to enjoy the life you're working so hard to build. 💗 What's one way you invest in yourself outside of your finances? Have a wonderful Friday, and happy investing!! 💚💚 read more
SPX: Indecisive action on Friday, but the price is not oversold. Every day, I send modeled levels for the next session via email (join the list using the link in bio). For Monday: Bearish below 7,632, targeting 7,603 and 7,583. Hard resistance at 7,647.2, then 7,651.9 follows. $SPY
I don’t think debt is the enemy. I think not understanding how it works can be. Consider two women. At 29, one borrows $180,000 to buy an apartment building. Her tenants help pay the mortgage, and she gradually uses the income to acquire more properties. Twenty years later, those properties are paid off, generating income and giving her more financial freedom. The other woman borrows money, too. For a car, a wedding, and a lifestyle she wants to enjoy today. There’s nothing wrong with wanting those things. But the payments leave her with less money to save, invest, and build wealth over time. Same tool. Very different financial futures. This is what I find interesting about debt. It can help you build wealth, or it can consume the money you need to build it. Neither outcome is guaranteed. Property comes with risks, and borrowing magnifies both gains and losses. But understanding the difference between borrowing to acquire assets and borrowing to fund consumption can change how we make financial decisions. I think financial literacy is about more than learning to budget or pay off debt. It’s about understanding how money works so we can make choices that serve us in the long run. The goal isn’t to look wealthy. It’s to build wealth. And the more we learn, the better equipped we are to do that.read more
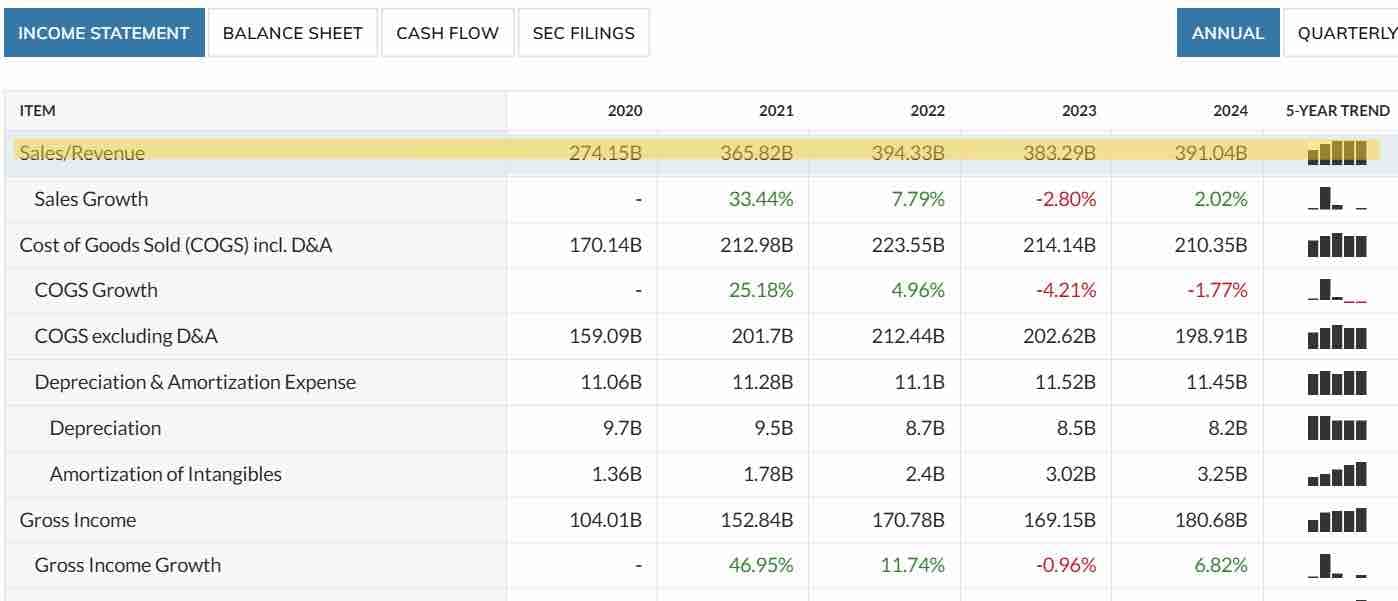
Here are 🚩3 big flags🚩that signal a company might not be a good investment, and I'll walk you through how to check for each one. (Free Stock Checklist at the end) --- 1️⃣ Declining Revenue or Earnings📉 🛑 Why it’s a red flag:A company with falling revenue or earnings may be losing market share, dealing rising costs, or the overall industry is shrinking. ✅ How to Check for This: A) Look at the Income Statement📊 - Find the company’s total revenue and net income in its latest financial report. Top-line & bottom-line, respectively. - Compare revenue and net income across multiple quarters/years. 3 years or 12 quarters is more than enough to indicate a trend - If both are consistently declining, it’s a warning sign. B) Check Earnings Reports🗂️ - Look at the company’s quarterly earnings reports to see if they’ve missed expectations multiple times. C) Compare to Competitors🔍 - Is the entire industry struggling, or just this company? 📚Website for financial reports: https://www.marketwatch.com/ --- 2️⃣ High Debt Levels 🛑 Why it’s a red flag:Companies with a capital structure heavily debt-reliant are more vulnerable in economic downturns and might struggle to repay obligations. ✅ How to Check for This: A) Find the Debt-to-Equity Ratio (D/E)📊 - Go to the company’s Balance Sheetin its latest report. - Find Total Debt and Total Equityand calculate: Debt-to-Equity Ratio = Total Debt ÷ Total Equity** - A D/E ratio above 2.0 (varies by industry) is usually risky. B) Check Interest Coverage Ratio🔍 - Look at the Income Statement for EBIT (Earnings Before Interest & Taxes). - Find Interest Expense and calculate:Interest Coverage Ratio = EBIT ÷ Interest Expense - If this ratio is below 1.5, the company may struggle to pay interest. 📚 Resources: https://www.investopedia.com/terms/d/debtratio.asp#:~:text=Key%20Takeaways&text=A%20company's%20debt%20ratio%20can,has%20more%20assets%20than%20debt --- 3️⃣ Poor Cash Flow 🛑 Why it’s a red flag:A company can be profitable on paper but still run out of cash to fund operations. ✅ How to Check for This: A) Find the Cash Flow Statement📜 - Look at Operating Cash FlowOCF). - If OCF is negative for multiple quarters, the company may be in trouble. B) Check Free Cash Flow (FCF)💰 - Free Cash Flow = Operating Cash Flow - Capital Expenditures - A company with negative FCF can’t reinvest in growth without taking on debt. 📚 Read more about Cash flow: https://www.investopedia.com/articles/stocks/07/easycashflow.asp ___________________________________________ Thanks for reading, I am open to engage in friendly conversations so I encourage you to leave a comment!💬 Access my free stock checklist at the link below⬇️ https://investingwithcole.gumroad.com/l/stockchecklist read more
What is a market index? Think of it as a scoreboard for a group of stocks. The S&P 500 tracks 500 large US companies, the Nasdaq Composite leans toward tech names, and Canada's TSX follows the biggest stocks on the Toronto exchange. You cannot buy an index directly, but funds like $SPY and $QQQ track them so one trade can give you a slice of the whole basket. That is why headlines quote indexes: a single number tells you whether the broad market rose or fell that day. Not financial advice.
Meta grew revenue 26% last quarter. The stock fell about 7% the next day. Tesla beat its cash-flow forecast by $6B. It still slipped after hours. Stocks don't react to good news. They react to news vs. what's already priced in. Before you buy, ask: what does this price already assume?
I own $AMD, but some of the most important earnings reports for my AMD thesis are happening before AMD even reports. This week, $MSFT, $GOOGL, $NOW and $AMZN all report earnings, and I'll be paying close attention. Microsoft, Google and Amazon should give us a better picture of where AI infrastructure spending is headed. I want to see strong cloud growth, continued AI demand and management teams committing more capital to expanding capacity. $NOW gives us another piece of the puzzle. Are businesses actually paying for AI software and seeing enough value to keep spending? Then there's $BN, which gives me exposure to the infrastructure supporting all this growth. Finally, $AMD reports November 3. That's where I'll be watching data center growth, EPYC demand and how much of this massive AI spending AMD is actually capturing. I think we're still in the early stages of AI adoption, but these earnings reports should give us a much clearer picture of how the opportunity is developing. Lots to watch this week! read more
Retired with No CPP, No OAS, No Pension — Just Covered Calls I’m 56 years old, and my retirement looks a little different from the traditional playbook. I don’t collect CPP. I don’t collect OAS. I don’t collect GIS. And I don’t have a defined benefit pension. My entire retirement income comes from high-yield covered-call ETFs. Right now, my portfolio generates approximately three times what I actually need each month to cover my basic living expenses. But instead of simply living on the bare minimum, I’ve entered what I call my travelling retirement stage. I’m currently spending around $150,000 a year enjoying retirement. That means I’m often out of the country for three to four months annually, exploring new places, experiencing different cultures, and making the most of the freedom I worked so hard to achieve. After all, what’s the point of building a retirement portfolio if you never get around to enjoying it? Spending Dynamically, Not Recklessly Here’s something I think gets overlooked in retirement planning: spending doesn’t have to be fixed. My basic living expenses are covered comfortably by my portfolio income. The additional spending is discretionary. If markets are strong and distributions are holding up, I’m happy to travel more, spend more, and enjoy life. If markets turn south or income starts coming under pressure, I can adjust. Fewer trips. Less discretionary spending. More money retained in the portfolio. My lifestyle is flexible. My ability to adapt is part of the plan. I don’t believe every retiree needs to spend the same amount every year, regardless of what the markets are doing. Reinvesting for Tomorrow Even though I’m retired, I haven’t stopped investing. I reinvest a minimum of 10% of my monthly portfolio income. Why? Because inflation doesn’t retire when you do. I also want a cushion against potential distribution reductions and the inevitable ups and downs of the market. Reinvesting helps me build that buffer while continuing to enjoy the income my portfolio generates today. Of course, reinvesting 10% doesn’t guarantee that purchasing power or capital will be preserved, but it gives me another tool to help manage those risks. And Here’s the Interesting Part… So far, this strategy has been working quite well. I’ve actually increased my total net worth since retiring. Think about that for a moment. I’m spending approximately $150,000 a year, travelling internationally for several months, living the retirement lifestyle I wanted, and my net worth has still grown. I’m not suggesting this will happen every year. Markets change, ETF distributions can fall, and high yields come with risks. I keep that in mind. But so far, the combination of portfolio income, flexible spending, and regular reinvestment has served me well. My Retirement Philosophy I don’t need to chase the biggest possible portfolio balance at the expense of enjoying my life today. I want my money working for me while I’m healthy enough to enjoy what it provides. I understand that my approach isn’t for everyone. High-yield covered-call ETFs have risks, and a large distribution doesn’t automatically mean a strong total return or sustainable income. But I’ve built my retirement around the strategy I believe suits my goals, my risk tolerance, and my lifestyle. I’m not waiting until I’m 70 to start living. I’m living now, managing my risks, and adjusting as circumstances change. Retirement isn’t just about how much money you have. It’s about what your money allows you to do. And right now, mine is allowing me to see the world. What about you? Would you be comfortable funding your retirement primarily through high-yield covered-call ETFs, or would you prefer the security of CPP, OAS, and a traditional pension? Let’s hear your thoughts in the comments!read more
18.97% annualized return since inception. A 10%+ yield. Amazing... It even beat the TSX 60, it’s benchmark!!! 🤯 So why did my analysis find that $HDIV UNDERPERFORMED a more comparable benchmark by 1.9% PER YEAR? That’s because HDIV isn’t really comparable to an unleveraged TSX 60 total return index. It has 1.25X leverage, significant concentration, much more tech exposure, US exposure, and a completely different portfolio construction.... And once I accounted for that, the “KING” narrative got a lot more complicated and well... you’ll see. I went under the hood on EVERYTHING is could in less than 20 minutes, from the 1.75% current cost, covered calls, leverage, distributions, ROC, total number of underlying stocks (and even the effective number of stocks), risk, drawdowns, and all the changes HDIV has made since launch (you will be SHOCKED by that one)! I also tried to answer as many of your HDIV questions as possible…. If I missed YOUR question, put it in the comments of the YouTube video pretty please. I’ll answer it there so everyone can benefit from the answer. Here it is!!! https://youtu.be/AWVSiutDV_M read more
QQQ holders bought SpaceX 15 trading days after its IPO. No profits. Around $2T valuation. Nobody decided to. Nasdaq changed its rules in May. The S&P 500 still wants 12 months of trading and profits first. Your index fund isn't passive. It's someone else's rulebook. Worth reading it.
📊 Prediction markets suggest a possible merger: 🔹 Before Mar 1, 2027: 41% 🔹 Before Apr 1, 2027: 47% 🔹 Before May 1, 2027: 71% 💰 RBC says SpaceX could acquire Tesla for $480 per share in a potential $3.74 trillion deal. 👀 Could this become one of the biggest deals in history? What do you think? 🤔👇 read more
What should investors know before buying covered-call ETFs? Is a high distribution yield really passive income, and how do you know if your investments are actually growing your wealth? In this episode of Moementum Finance, I'm joined by Zayla Saunders, Vice President of Online Distribution at BMO ETFs, to talk about her personal money journey, investing philosophy, and what she's learned from helping Canadians become more confident investors. Zayla shares how money wasn't openly discussed in her household growing up, how she went from financial planning and mutual funds to believing in broad-market index investing, and how reading "A Random Walk Down Wall Street" book helped change her perspective. We also discuss why she favours low-cost index ETFs, the importance of paying yourself first, and how keeping investing simple can help you build wealth over the long term. We dive into the growing popularity of covered-call ETFs and income investing, including the difference between distributions and total returns, return of capital, and why NAV erosion is real. Zayla also explains her work at BMO ETFs, how the team supports self-directed investors, and why understanding what's under the hood matters before buying an ETF. We also discuss ETF overlap, common investing mistakes, market timing, BMO's T-Series ETFs, and how Zayla approaches her own portfolio. She shares her perspective on financial independence, explaining why she values financial autonomy and the freedom to make your own choices. Plus, we talk about spotting red flags in online financial content, building better investing habits, and why you can still enjoy your money while working toward your financial goals. 💬 We'd love to hear from you: If you could go back and give your younger self one piece of money or investing advice, what would it be? Let me know in the comments! https://www.youtube.com/watch?v=hiUF2bQvs1Yread more
📊 The selloff spread beyond tech as oil pushed past $100. The Dow dropped 1.23% to 52,215.16, the S&P 500 slipped 0.52%, the Nasdaq lost 0.21% and Canada’s S&P/TSX Composite fell 0.52%. 💳 American Express ($AXP) fell more than 3% after announcing it will cut about 5% of its global workforce, citing the need to prepare for AI. Caterpillar edged down about 2% and Goldman Sachs lost more than 1%, adding to the Dow’s drag. 🛒 Discount retailers sank on diesel costs. Dollar Tree ($DLTR) and Dollar General ($DG) each dropped around 5% after Wells Fargo warned that third quarter diesel prices, up roughly 60% year over year, will more than double the hit to earnings per share to 6.2%. Dollar Tree is the most exposed, facing about $25 million in third quarter profit pressure. 📡 Rogers Communications ($RCI) slid despite beating on both lines, with adjusted earnings of $1.29 per share on revenue of $5.44 billion. Wireless service revenue fell 1%, mobile ARPU dropped to $55.22 from $56.70 and postpaid net additions collapsed to 6,000 from 62,000 a year ago. 🚚 Mullen Group ($MTL) gave it all back, falling 10.90% to $28.76 to finish as the worst TSX performer. The logistics company had led the index Thursday with an 11.50% jump on record quarterly results. 🛢️ Brent rose 3.1% to settle at $116.72, its highest since April, and WTI gained 3.8% to $103.27 on reports the U.S. and Israel may be planning renewed strikes on Iran. ExxonMobil, Chevron and ConocoPhillips all hit all-time highs, while uranium and clean energy ETFs fell to 52-week lows. 👨🏻💻 Researched and written daily by @timeminoread more
📊 AI spending fears hit tech hard while oil spiked. The Nasdaq dropped 2.6% to 26,008.86 for its worst day since June, the S&P 500 fell 1.21%, the Dow edged up 0.02% and Canada’s S&P/TSX Composite sank 0.97%. 📱 Meta ($META) slipped about 7% despite beating on revenue with upbeat guidance. The company raised its capital expenditure forecast, and comments about how much AI funding it still needs sent the stock over and dragged the broader tape with it. ⚡ Power names tied to the data center buildout got crushed. GE Vernova ($GEV) and Bloom Energy ($BE) each fell more than 11%, Vistra shed over 10%, Quanta Services dropped more than 8% and Eaton lost nearly 7%. 💉 Moderna ($MRNA) cratered 17.57% to $202.63 after partial data on its Merck-partnered cancer vaccine leaked. The full release later in the day actually looked good, showing a 42% reduction in recurrence or death risk for certain melanoma patients versus Keytruda alone. 🚚 Mullen Group ($MTL) jumped 11.50% to $32.28 to lead the TSX on record quarterly results. Adjusted earnings of $0.52 per share beat the $0.41 expected and revenue of $653.2 million topped $614.9 million, up 16.3% year over year. 🛢️ Brent surged 4% to settle at $113.17, its highest since May, after a report that the U.S. and Israel plan renewed strikes on Iran following the midterms. WTI gained 2.39% to $99.47. Money ran to Treasurys, with the 10-year yield dropping more than 17 basis points to 4.972%. 👨🏻💻 Researched and written daily by @timeminoread more
Meta raised its capex forecast again and the stock dropped 7%. Is the AI buildout still worth the spend?
We're celebrating Episode 25 of Financial KarMoe and Moe's birthday 🎂 (not 25! lol)! 🥳🎈 This episode, @karyungtom and Moe discuss common investing mistakes, covered call ETFs vs. broad-market investing, and why a high distribution doesn't necessarily mean higher returns (Shoutout to @scottsinvesting, @saini, @ian_s whose posts we reviewed). We also answer @griff79's question from Blossom about funding your TFSA for 2027, explore value investing during inflation, and debate whether long-term investors should actually hope for a market crash. To wrap things up, we get personal with birthday freebies, frugality, and Canada's tipping culture. Is it getting out of hand, especially when picking up takeout or a coffee? 😅 💬 What do you think? Has tipping culture in Canada gone too far? Let us know! https://www.youtube.com/watch?v=yBthz2Wmr2o
I am currently 47 years old. Unfortunately in that time frame I have lost a lot of family members. Some (most) were accidents, some to age, some to cancer, and one to suicide. That’s 11 deaths total. Only 1 person out of 11 had a will. When you are grieving the last thing you want to do is close an estate up. It’s even harder if nothing has been prepared in advance. After the initial shock of the death settles (the phase where everyone is usually nice), greed comes through in a most alarming manner. I’ve watched people turn into monsters. Make sure you have a will!!!! or people will fight. I know most people hate thinking about their death or their spouses death but honestly it’s just a fact of life. I’ve personally been the executor of 2 estates now. This is my advice: 1. If your young get life insurance. If you’re retired it’s not worth it. 2. Make sure you have a will. 3. Make sure you have a personal directive. 4. Make sure you have a power of attorney set up. 5. If your married make your spouse the beneficiary of your TFSA and RRSP(has to be done through the account not the will), they will roll into the spouses account without taxation. 6. If you’re married, and you own a house, make sure both names are on the title, joint tenant, NOT tenant in common. This activates right of survivorship on property and doesn’t have to go through the estate. 7. If you’re married, both people should have their name on all the vehicles, joint, otherwise it’s a headache after death. 8. Buy a file folding system. I have a plastic one that has a clasp and handle. 9. Put EVERYTHING in this file folder that would be needed if you died tomorrow. a) all land titles B) information on house insurance so it can either be eventually canceled or name changed over. C) your will (or the location of your will), power of attorney, and personal directive D) the information for your car, car insurance, and registration on vehicles. E) information on life insurance. F) all current year papers needed for filing your taxes. Because the survivor will have to do it and will need that information. G) where your household bills are. ALL OF THEM, electricity, gas, Netflix, magazine, subscriptions everything you can think of that is in their name. Because you are going to have to cancel them. H) their credit card information where to contact to cancel the cards I) birth certificate, SIN numbers, marriage, license, etc. J) information on all your investments accounts, bank accounts, etc. K) anything else you can think of for your situation If you’re married, I’d have one box per person. When you die, the funeral home will issue many death certificates. And your lawyer will give you copies of the will. These will be needed to change over any accounts. Everything else goes through the estate which is taxed and the lawyers take their fees so I’d avoid this as much as possible especially if you’re married. This is why having property in both people‘s names is so important because it doesn’t have to go through probate. I am widowed now and I have my black file folder and my two remaining children know if something happens to me, all they have to do is grab the folder. Everything they need to take care of my estate will be located in this folder. At the beginning of every year, I open this file up and go through everything to make sure it’s up-to-date. If you are young and do not own much or can’t afford a will, you can draft one up but it must be handwritten to be classified as a legal document. You cannot type it out!! If you’re not worth much, everything will most likely be sold to pay your bills and cover your funeral expenses. But you can state who your executor will be in your handwritten will. Disclaimer I’m not a lawyer or an accountant and this is not legal advice. Talk to a lawyer and talk to an accountant. Make sure everything is set up for you and your situation. These are situations that I personally ran into. Good luck Also I’ll add in. IF you have a lot of assets make an appointment with your accountant first. They will tell you how to properly set things up. Then take that information to your lawyer. read more
I'm working on an ETF deep dive into $HDIV, one of the most requested ETFs. I want to know what YOU actually want answered.... not just the advertised yield or how much it pays every month. I want to dig into the numbers and the questions that matter to YOU. How sustainable are the distributions? How much comes from return of capital? What are the underlying holdings actually doing? How does the leverage affect risk? Is HDIV delivering enough total return to justify its costs and complexity? Those are just a few starting points and examples.... What are the HARD questions you want me to answer? And as always, this is open to all, whether you're a holder, thinking of buying it ... or skeptical of the whole covered call strategy. I'd love to hear what you want to know and then i'll do my very best to separate the marketing from the data. Ps. The tougher the questions, the better 😏
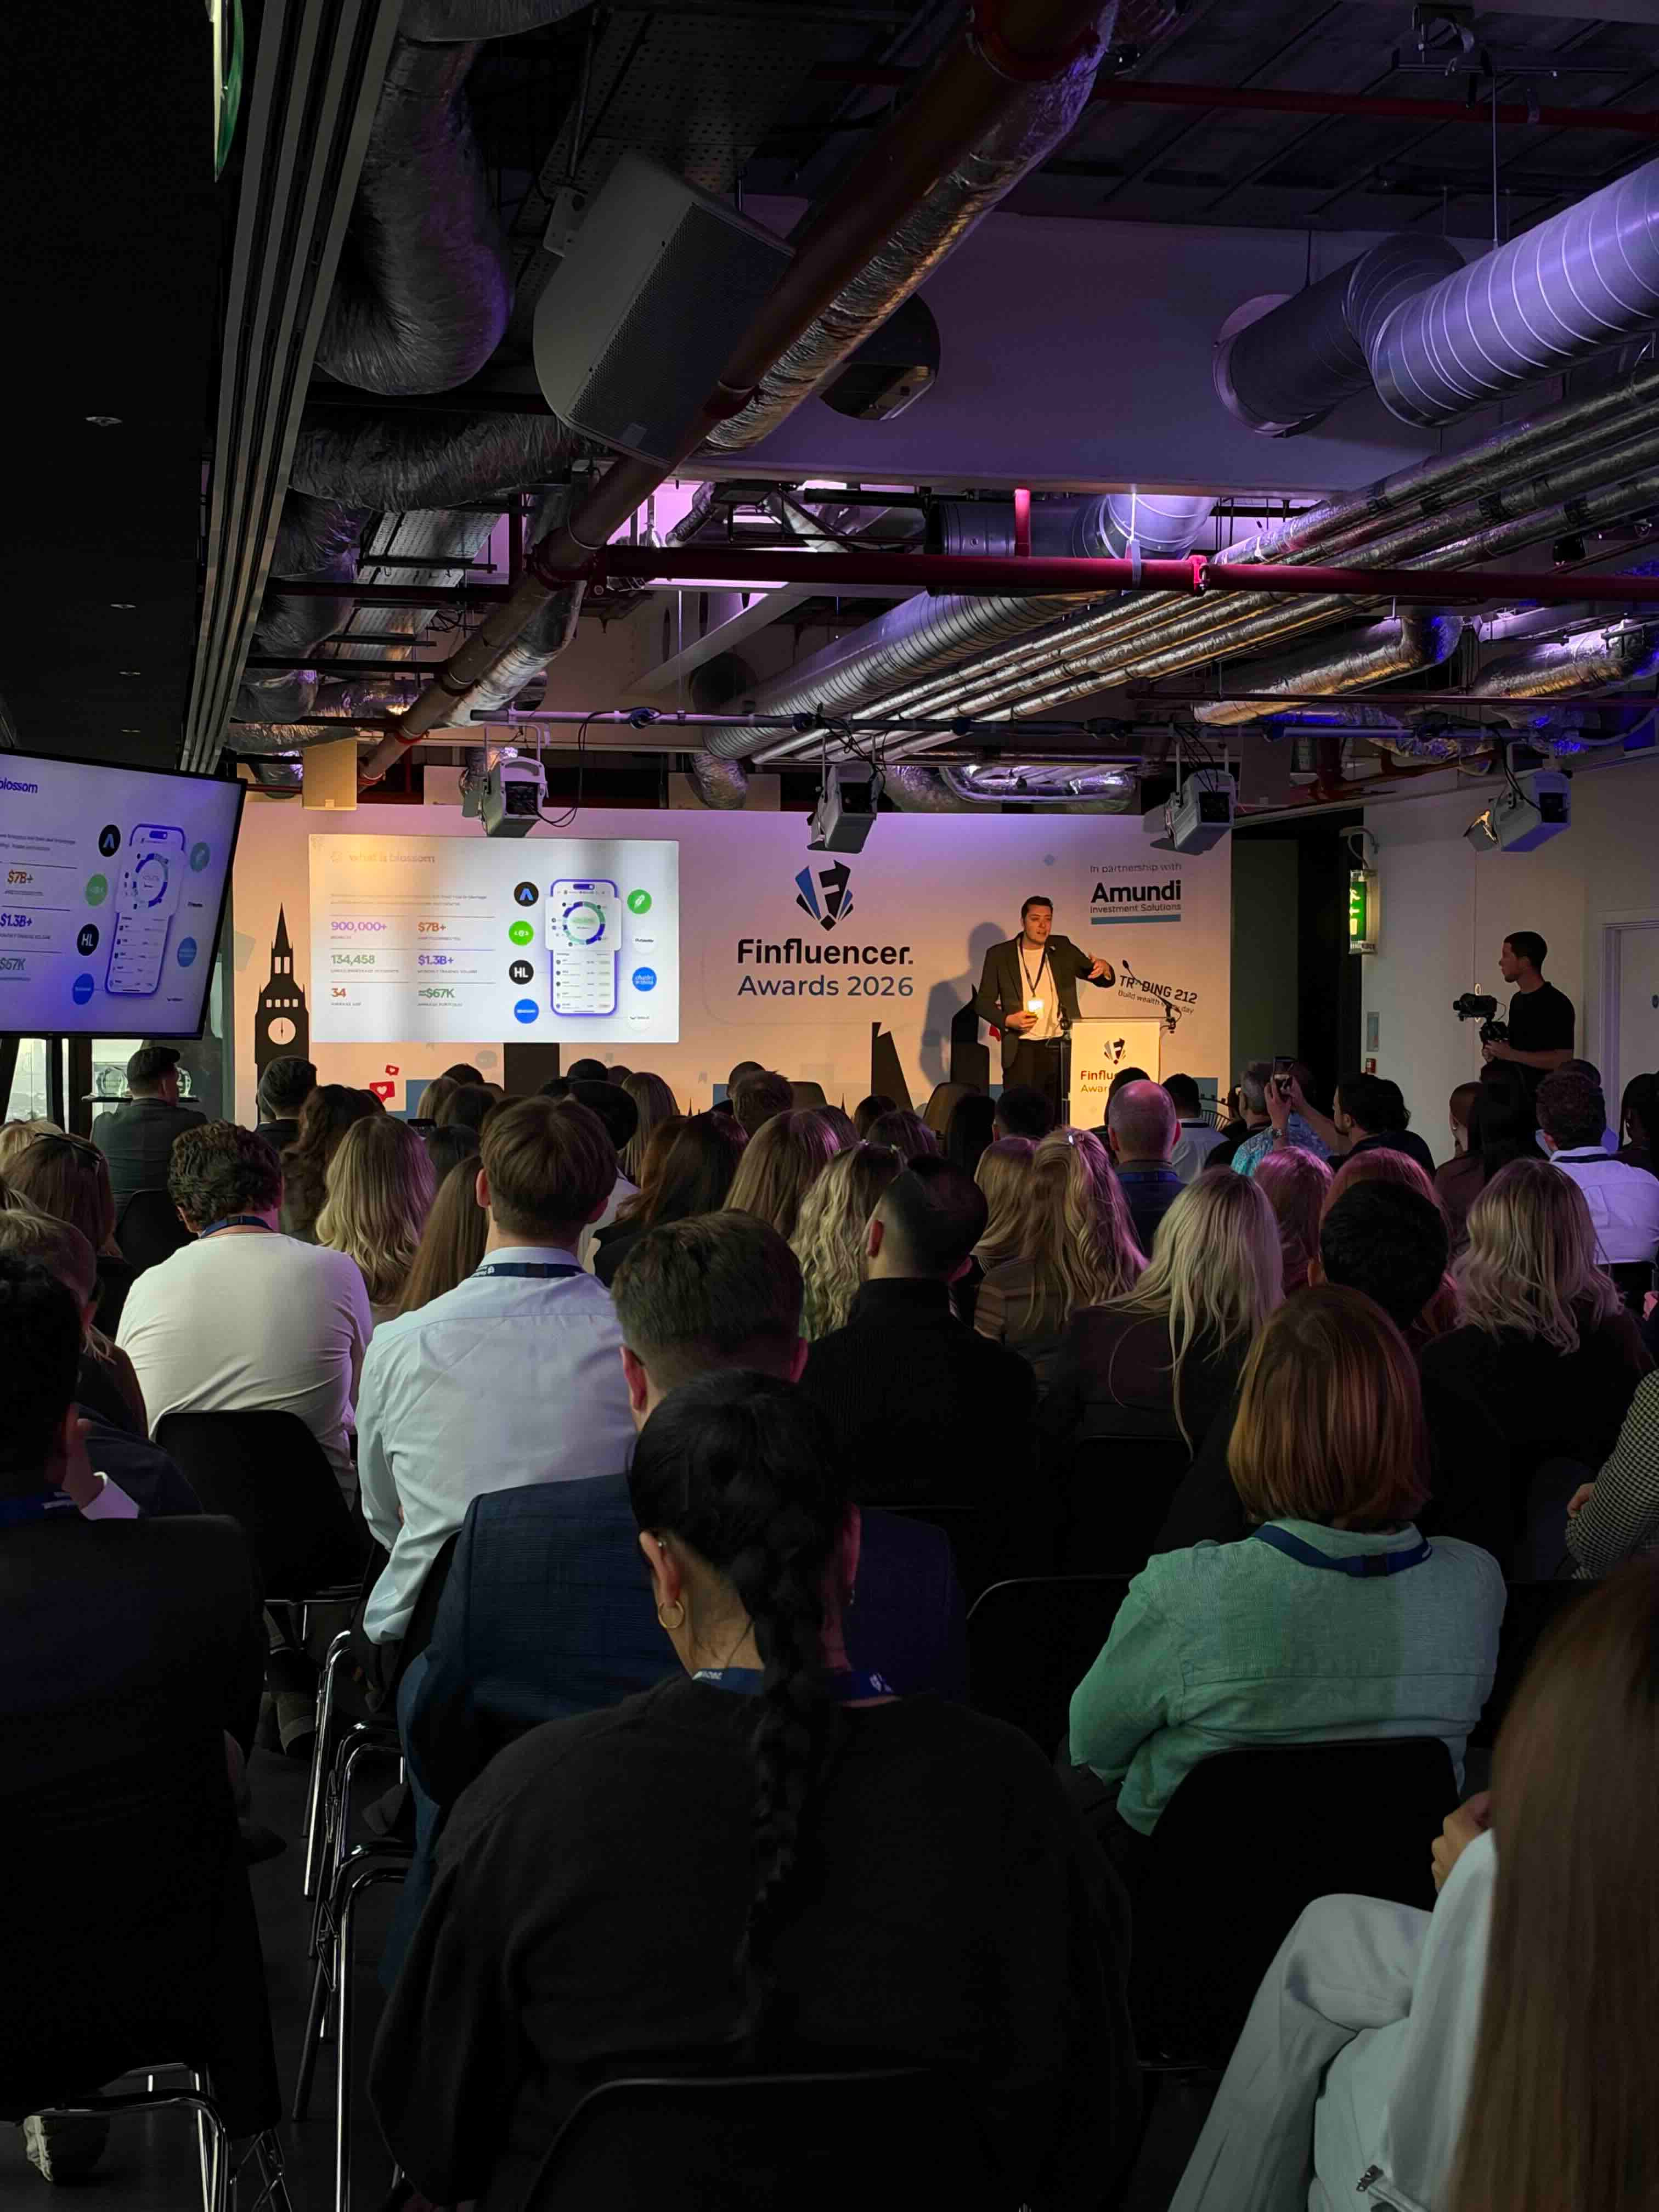
Just arrived home from a quick trip to London - it was my first time visiting. What a cool city. Full of friendly people. And so much character! Found it super interesting to learn that there’s still very much a ‘saving’ mentality in the UK. But that seems to be changing. Shoutout to Max for delivering an incredible speech (as usual) about Blossom. He presented our platform and mission in a great way and it was very well received by the Brits!
2,620 views
Join the conversation with 500,000+ other investors 💸
Create an account to get access to everything Blossom has to offer!
📊 Personalized algorithm based on your investing style, experience level and interests
📈 Powerful portfolio and dividend tracking tools
👀 See what top creators and others in the community are investing in