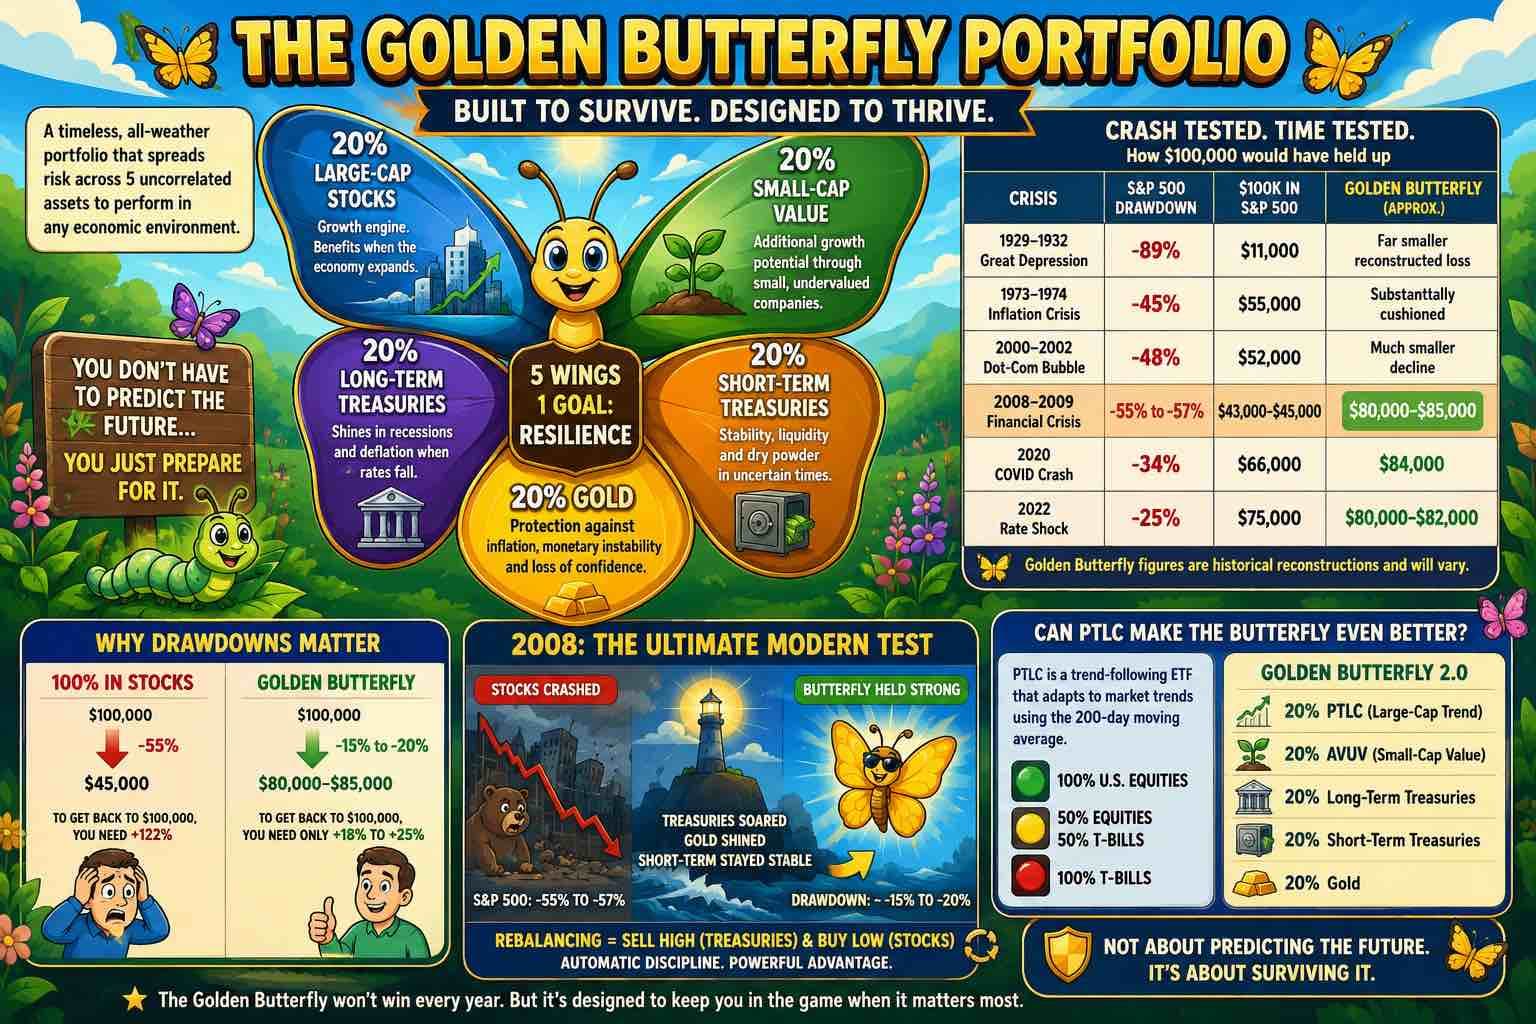
🦋 The Golden Butterfly: Could This Portfolio Have Survived Every Major Market Crash Since 1929? Imagine investing $100,000 the day before one of the worst stock-market crashes in history — then watching it fall 30%, 50%, or during the Great Depression, almost 90%. Most portfolios assume one thing: over time, stocks go up. The Golden Butterfly Portfolio asks something very different — what if we built a portfolio designed to survive almost anything? Depression, inflation, deflation, banking crises, rate shocks, pandemics, even environments where stocks and bonds fall together. Despite the whimsical name, it's one of the more serious attempts ever made to engineer resilience into a portfolio. ⸻ 🦋 What Is the Golden Butterfly? Popularized by Portfolio Charts, the Golden Butterfly is a simplified evolution of Harry Browne's Permanent Portfolio, built from five equal parts: U.S. large-cap stocks (20%) $VOO$SPY$VFV, U.S. small-cap value stocks (20%) $AVUV, long-term U.S. Treasuries (20%) $TLT, short-term U.S. Treasuries (20%) $SHY, and gold (20%) $GLD$IAU$ZGLD. In short: 40% stocks, 40% Treasuries, 20% gold. *At times up to 60% Treasuries with $PTLC The logic isn't prediction — it's response diversity. Each asset reacts differently to economic regimes: stocks benefit from growth, small-cap value adds a long-term equity premium, long Treasuries thrive in deflation and crises, short Treasuries provide stability, and gold responds to inflation and monetary stress. Instead of asking "what will happen next?", the portfolio assumes something unexpected will happen — and you already own the response. ⸻ **A note on the numbers below:** The Golden Butterfly is a modern construct, and reliable backtested data for it generally only goes back to the early 1970s (gold ownership was restricted for U.S. individuals until 1974, and usable small-cap value data doesn't extend to 1929). The 1929–1932 figures are a rough hypothetical reconstruction based on how each asset class is known to have behaved, not a verified historical backtest — treat them as illustrative, not precise. ⸻ 💀 1929–1932: The Great Depression Stocks collapsed nearly 90%, turning $100,000 into about $11,000. The Golden Butterfly didn't exist yet, but its structure gives us a reasonable sense of how it would have behaved: only 40% of the portfolio is exposed to equities, so the stock sleeve would have fallen from $40,000 to roughly $4,400, while the remaining 60% — bonds and gold-like exposure — wouldn't have collapsed anywhere near as hard. Putting it together, the portfolio would likely have seen a total drawdown in the range of **$100,000 → roughly $70,000–$80,000** (about 20%–30%), versus stocks' 89% collapse. The key difference is structural: no single asset class defines survival. ⸻ 🔥 1973–1974: Inflation Shock Stocks fell roughly 45%, turning $100,000 into about $55,000. In the Golden Butterfly, the 40% equity sleeve would have fallen to about $22,000, long Treasuries would have struggled against inflation, short Treasuries would have held their value, and gold — newly legal to own and entering one of its strongest runs — would have risen sharply enough to offset much of the damage. Net result: **$100,000 → about $80,000–$90,000**, a 10%–20% drawdown. Rather than being destroyed by inflation, the portfolio absorbed it through gold. ⸻ 💻 2000–2002: Dot-Com Collapse Stocks fell roughly 48%, turning $100,000 into about $52,000. The equity sleeve would have dropped to about $20,800, but falling rates lifted long Treasuries, short Treasuries stayed steady, and gold added further diversification. Estimated outcome: **$100,000 → roughly $75,000–$85,000**, a 15%–25% drawdown — losing about a fifth to a quarter of value instead of nearly half. ⸻ 🏦 2008–2009: Global Financial Crisis This is the most important case. Stocks fell 55%–57%, turning $100,000 into about $43,000–$45,000. Inside the Golden Butterfly, the equity sleeve took a real hit, but long Treasuries surged, gold acted as a crisis hedge, and short Treasuries held steady — bringing the estimated drawdown to just 15%–20%, or **$100,000 → roughly $80,000–$85,000**. The contrast is stark: stocks alone landed near $45,000, versus roughly $82,000 for the Golden Butterfly. That's the difference between forced panic and controlled rebalancing. After the crash, bonds were high and stocks were low, which mechanically pushed the portfolio toward selling strength and buying weakness — exactly the behavior most investors struggle to do on their own. ⸻ 🦠 2020: COVID Crash Stocks fell about 34%, turning $100,000 into about $66,000. The equity portion would have dropped sharply, but Treasuries rallied and gold held or rose slightly, bringing the estimated drawdown to 12%–18%, or **$100,000 → roughly $82,000–$88,000**. Even in a crash this fast, diversification reduced both the speed and the depth of the damage. ⸻ ⚠️ 2022: Stocks and Bonds Fall Together This is one of the hardest environments for any diversified portfolio: stocks fell about 25%, but bonds dropped too as rates rose sharply. In the Golden Butterfly, stocks fell, long Treasuries fell, gold only partially offset the damage, and short Treasuries provided some stability — landing the estimated drawdown at 18%–20%, or **$100,000 → roughly $80,000–$82,000**. Even when diversification partially fails, no single asset dominates the destruction. ⸻ 📊 The Unified Pattern Across All Crashes The pattern across every era is consistent: stocks alone can fall anywhere from 40% to 90% depending on the crisis, while the Golden Butterfly typically falls in the 15%–30% range regardless of what kind of crisis it is. A $100,000 stock portfolio can become anywhere from $10,000 to $60,000 depending on the crash; a $100,000 Golden Butterfly typically becomes $70,000–$85,000. Different crises, same outcome — losses get distributed instead of concentrated in one place. ⸻ 🌦️ Enter Ray Dalio's All Weather Portfolio The All Weather ($ALLW) strategy is built on a similar idea: economic regimes rotate, so portfolios should be balanced across them. Compared to the Golden Butterfly, All Weather is more macro-balanced while the Golden Butterfly is simpler and more equity-heavy — but both aim at the same goal: surviving multiple economic environments rather than betting on one. ⸻ 🥊 The Key Structural Difference Two things separate them. First, growth exposure: All Weather typically holds less equity than the Golden Butterfly, making it the more conservative of the two. Second, inflation protection: All Weather spreads that job across both gold and commodities, while the Golden Butterfly concentrates it in gold alone. ⸻ 🚦 Where PTLC Fits In PTLC $PTLC introduces a different mechanism, $VOO that automatically rotates 50%-100% into treasuries after 5 day draw down, it has averaged 10%+ over the last 5 years, giving away some upside in exchange for a built in circuit breaker (see one of my previous posts)— trend-based risk control. Instead of always holding equities, it can reduce exposure during downtrends, which raises an obvious question: can that improve one part of the Butterfly? ⸻ 🦋 Golden Butterfly 2.0 Swap large-cap equities for PTLC (trend-based large caps), and the portfolio becomes: PTLC, small-cap value, long Treasuries, short Treasuries, and gold. This changes behavior, not philosophy — but it comes with trade-offs. It tends to do better in prolonged bear markets and worse in fast reversals, and can lag during strong bull markets. ⸻ 🧠 The Real Genius of the Golden Butterfly The portfolio isn't trying to predict anything — it assumes multiple types of failure will occur over time, and spreads the job of handling them accordingly. Stocks handle growth, bonds handle deflation, gold handles monetary stress, small-cap value adds equity diversification, short Treasuries provide liquidity, and PTLC (optionally) adds trend defense. ⸻ 🏆 Is It Better Than the S&P 500? Wrong question. The S&P 500 wins in long bull markets. The Golden Butterfly wins in survivability and behavioral stability — because the real constraint most investors face isn't return, it's whether they can stay invested after a crash. ⸻ 👴 Why This Matters Most in Retirement A 50% drawdown isn't just a paper loss — it's a withdrawal crisis. A $1,000,000 portfolio falling to $450,000 forces withdrawals from an already-damaged base, which is exactly what sequence-of-returns risk means in practice. The Golden Butterfly softens this by ensuring something is always available to sell without locking in the worst possible losses. ⸻ 🦋 Final Thought Most investors ask, "What will make me the most money?" The Golden Butterfly asks a different question: "What structure survives the widest range of disasters?" Since 1929, markets have survived depressions, inflation shocks, bubbles, crises, pandemics, and rate shocks — and through all of it, no single asset class survives everything. So the portfolio doesn't try to find the winner. It just makes sure no single loser can destroy you. It doesn't try to win every crisis. It just tries to keep flying. *The pre-1970s figures in this piece are illustrative reconstructions, not verified historical backtests, and all dollar figures are estimates rather than precise historical data. This is not investment advice.*
1,118 views
5 Comments
Enid Vadeanu@enidv · 2h
Good post.
Max Penders@mjpenders · 2h
You should look into managed futures
Harry @harry9129 · 3h
Love it, very nice elaborated
Join the conversation with 500,000+ other investors 💸
Create an account to get access to everything Blossom has to offer!
📊 Personalized algorithm based on your investing style, experience level and interests
📈 Powerful portfolio and dividend tracking tools
👀 See what top creators and others in the community are investing in