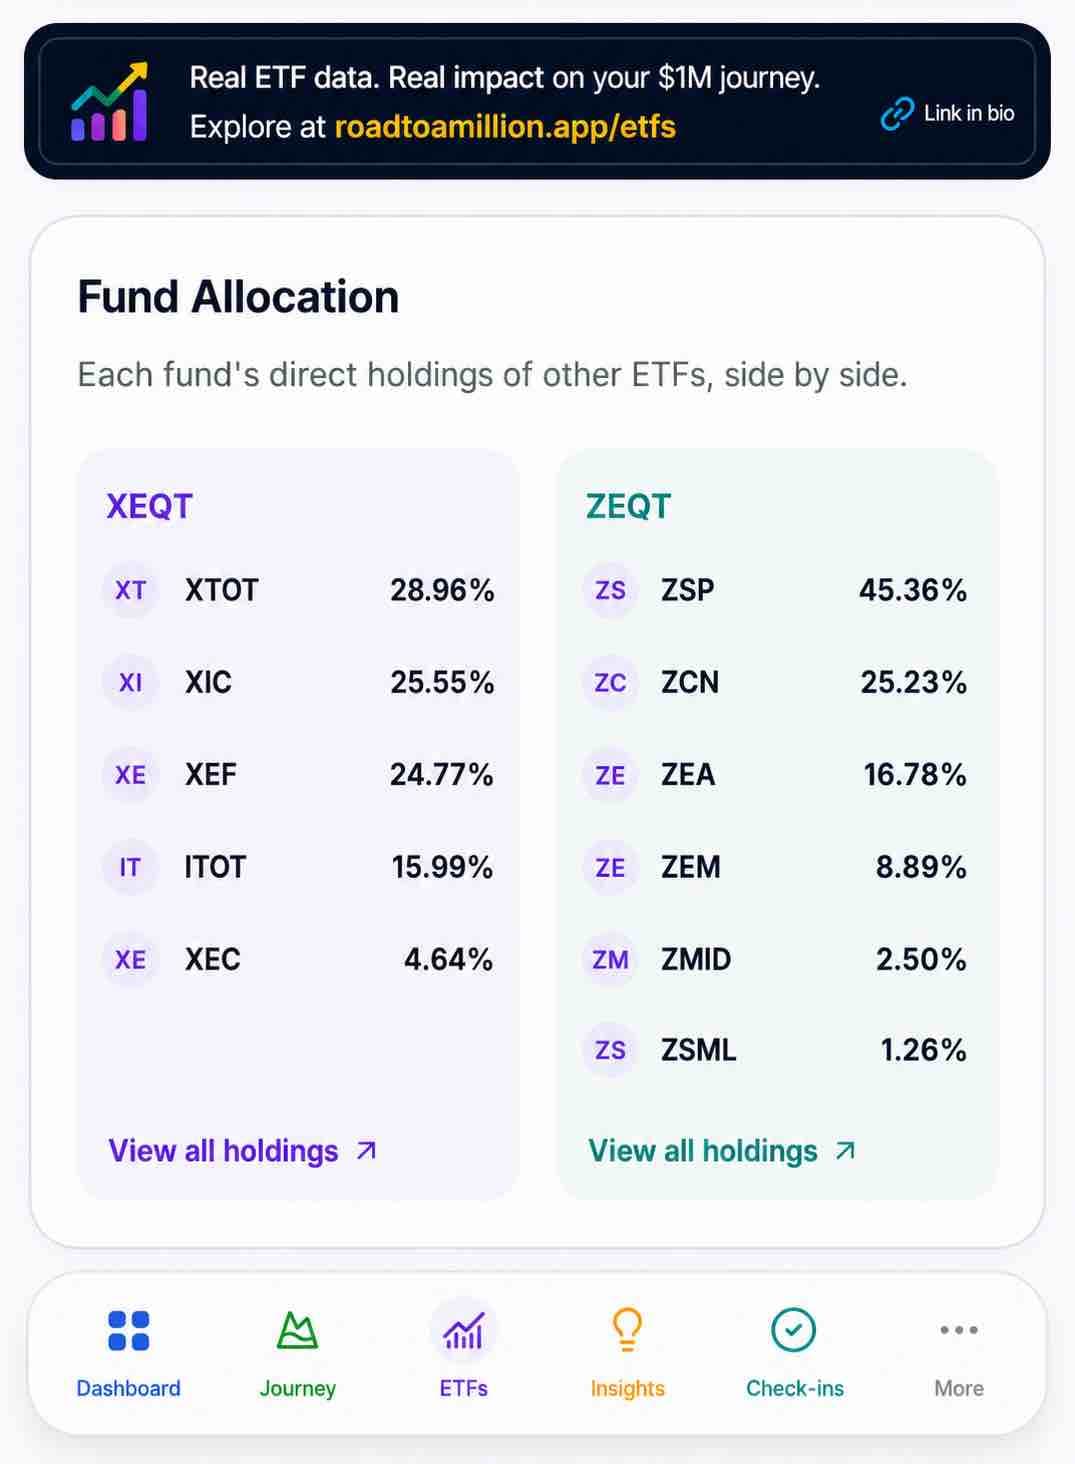
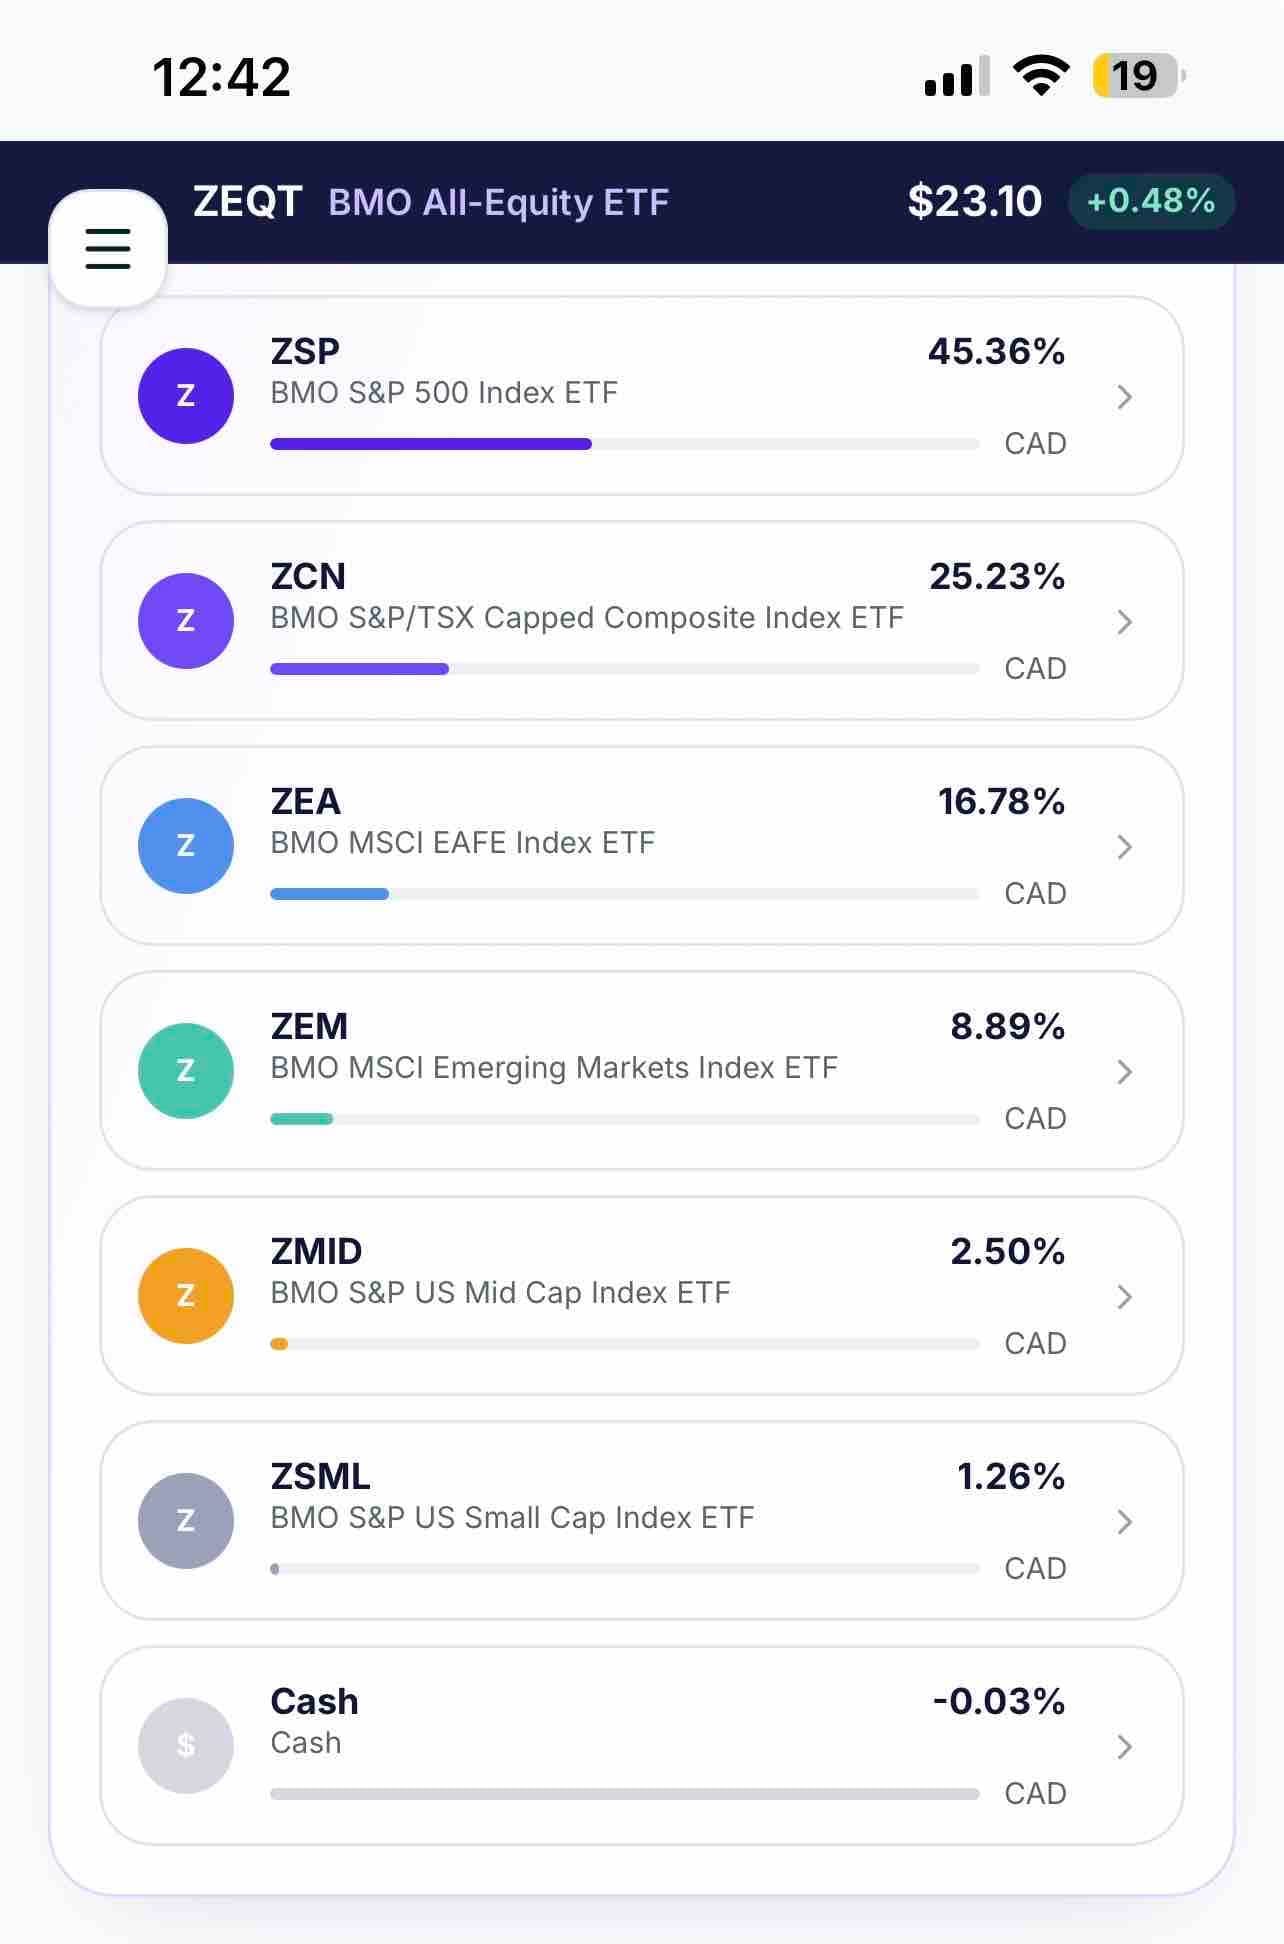
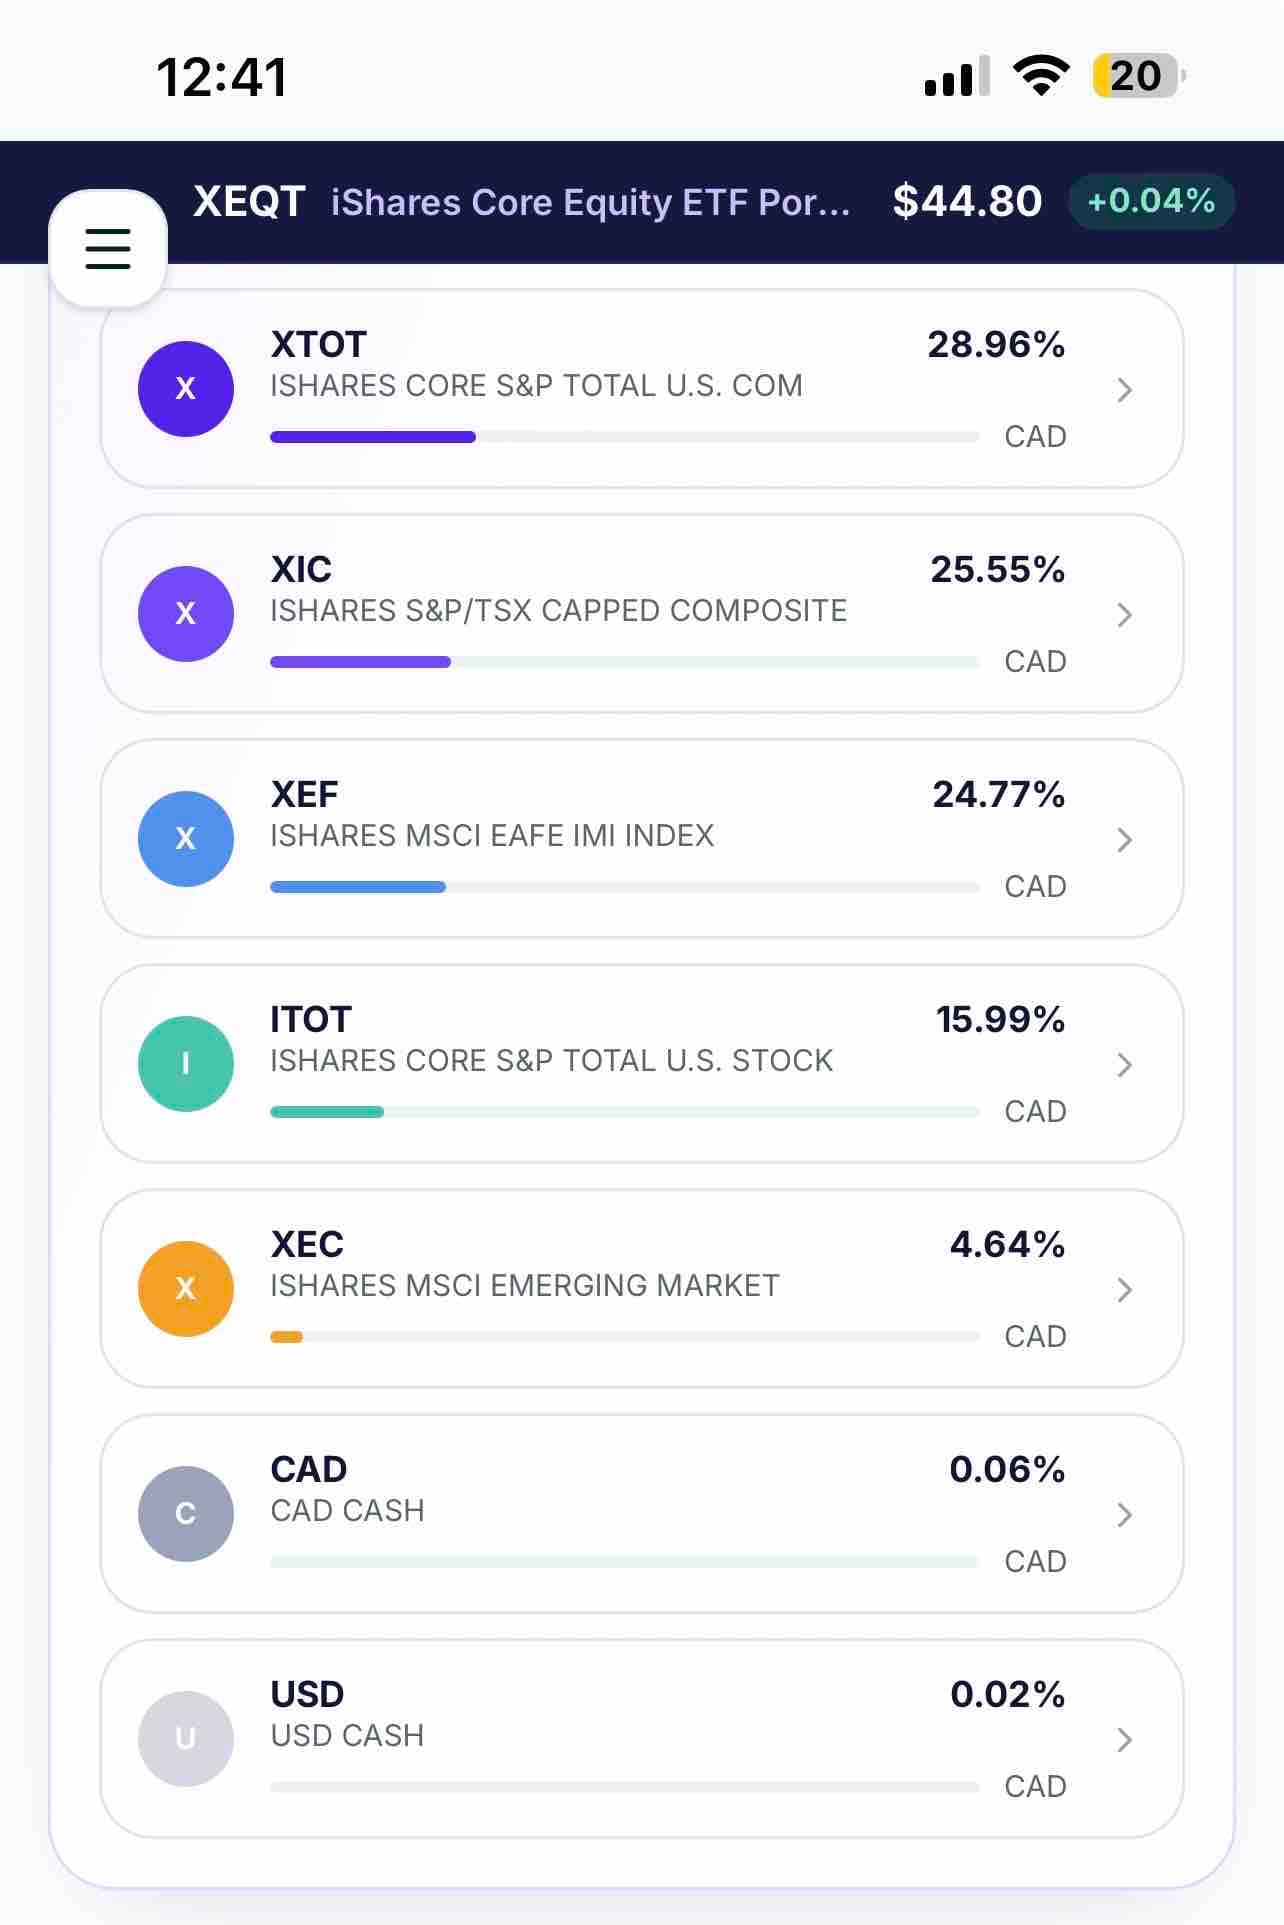
Part 7 of my series on rethinking the Canadian ETF experience. $XEQT and $ZEQT are often grouped together because they’re both globally diversified, all-equity ETFs. But once you look beneath the surface, they’re built quite differently. XEQT • XTOT (iShares Core S&P Total U.S. Market ETF) — 28.96% • XIC (iShares S&P/TSX Capped Composite Index ETF) — 25.55% • XEF (iShares MSCI EAFE IMI Index ETF) — 24.77% • ITOT (iShares Core S&P Total U.S. Stock Market ETF) — 15.99% • XEC (iShares MSCI Emerging Markets IMI ETF) — 4.64% ZEQT • ZSP (BMO S&P 500 Index ETF) — 45.36% • ZCN (BMO S&P/TSX Capped Composite Index ETF) — 25.23% • ZEA (BMO MSCI EAFE Index ETF) — 16.78% • ZEM (BMO MSCI Emerging Markets Index ETF) — 8.89% • ZMID (BMO S&P U.S. Mid Cap Index ETF) — 2.50% • ZSML (BMO S&P U.S. Small Cap Index ETF) — 1.26% At first glance, the two funds look almost identical. But their underlying construction is surprisingly different, which helps explain some of the differences we’ve seen in performance, holdings, sector exposure, and country allocation.
1,812 views
3 Comments
Richard Verhaeghe@ravonar · 4h
The downside is that both have a large concentration in their top 15 holdings, so while it says you have exposure to thousands of companies, NVIDEA Microsoft etc is 10-15-% of your portfolio which is why I’m adding about 10% $VVL even though it has a higher MER fee and some $SCHD - but admittedly I’ve been orange pilled so now that we’re at a cycle bottom most of my funds on Questrade are being diverted to anything bitcoin based including $BDAY and $MSTR$MSTE
Join the conversation with 500,000+ other investors 💸
Create an account to get access to everything Blossom has to offer!
📊 Personalized algorithm based on your investing style, experience level and interests
📈 Powerful portfolio and dividend tracking tools
👀 See what top creators and others in the community are investing in