Your Portfolio Returned 20%... But Did It?
STATS STATS STATS.
In the world of professional sports there are stats for nearly every metric of the game, and people love to study them.
Investing is really no different. There is no shortage of statistics and ways to measure performance. Some are more useful than others, but if you have ever looked at the same investment and wondered how people can come up with completely different return numbers, this is why.
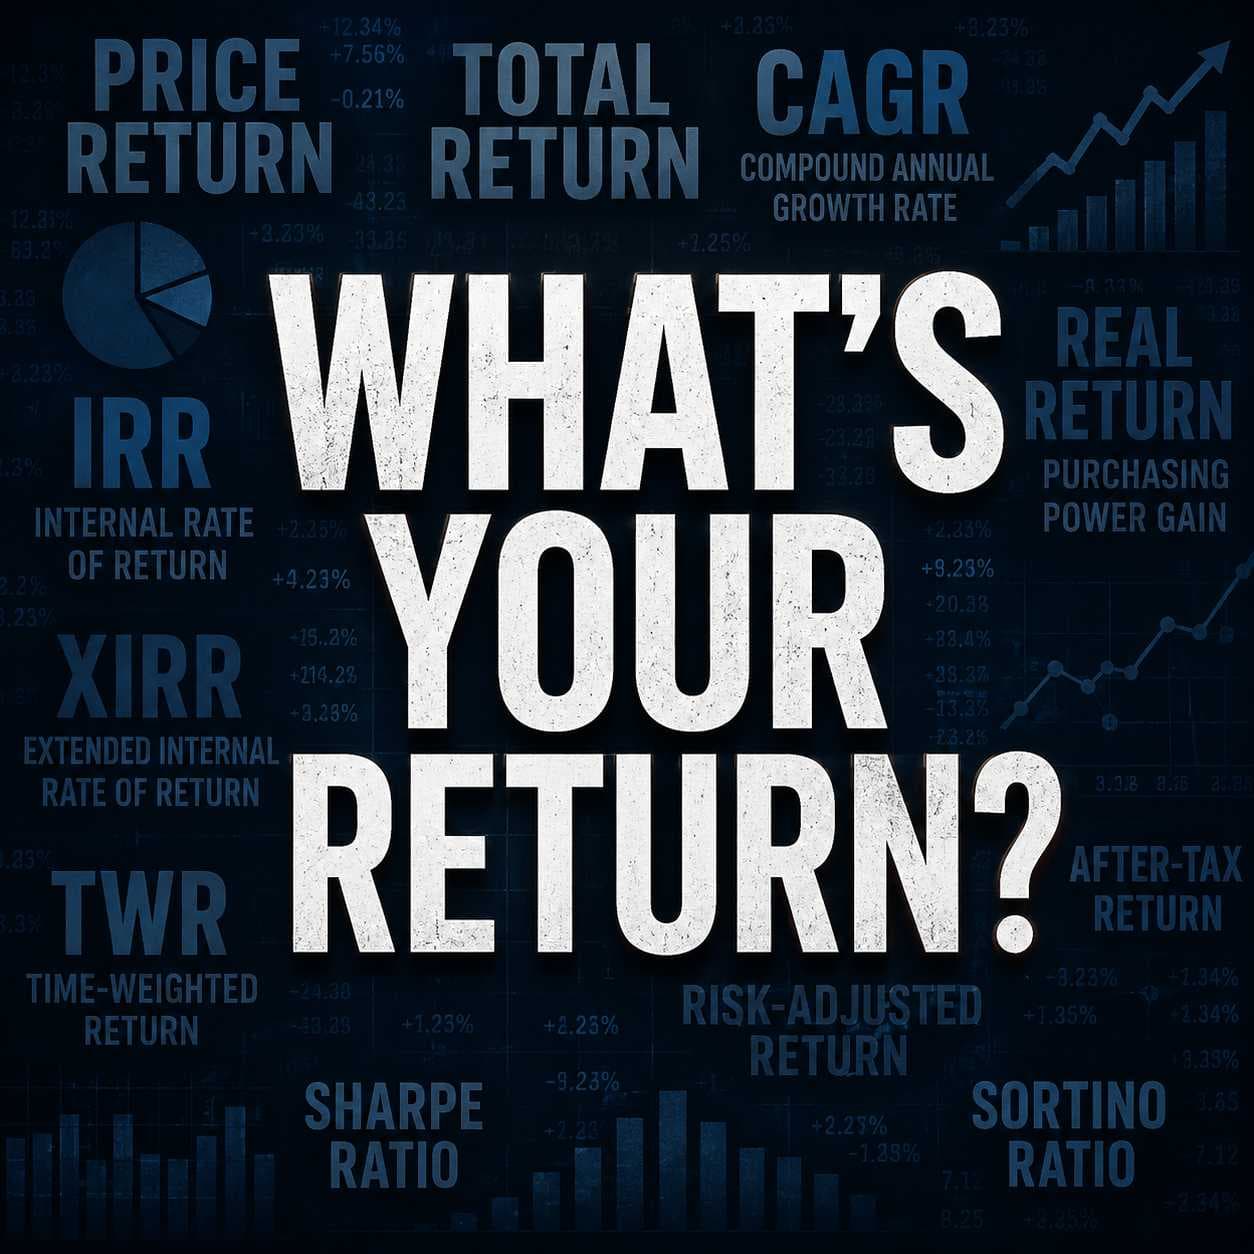
There isn't just one way to measure return. Let’s look at a few of the more common ones, what each one is actually measuring, and a simple way to understand the difference.
Price Return: What happened to the price?
This is the simplest one. If you bought an investment at $100 and it is now worth $120, your price return is 20%. The problem is that price return ignores any dividends, distributions or other cash paid along the way. That can make it a pretty incomplete measure for income-producing investments.
Total Return: What happened to the investment including income?
Total return combines the change in price with the income generated by the investment. If you invested $10,000 and the investment is now worth $12,000 while also paying you $1,000 in cash distributions, your total return is 30%. You have $12,000 worth of investments plus the $1,000 in cash you received, for a total value of $13,000.
If you used a DRIP and reinvested those distributions, you wouldn’t add the distributions again when calculating your return. They were used to buy additional shares, so their value is already reflected in the current value of your investment. This is generally a much better way to compare investments that pay different levels of income because it looks at the whole return instead of just the price chart.
CAGR: What was the equivalent annual compound growth rate?
A 30% total return sounds great, but there is a pretty big difference between making 30% in one year and making 30% over five years. CAGR, or Compound Annual Growth Rate, converts that total growth into an annualized compound return. For example, turning $10,000 into $13,000 over five years is a 30% total return, but works out to only about a 5.4% annualized return. This makes it much easier to compare investments held for different lengths of time.
Now we start getting into the finance-nerd stuff.
IRR: What rate of return makes my cash flows add up?
Internal Rate of Return looks at the cash going into and coming out of an investment and calculates the rate of return that makes those cash flows balance out. It is useful when there are multiple cash flows over time, especially when they happen at regular intervals, such as monthly or annually. Real-life investing usually isn’t that neat which brings us to XIRR.
XIRR: What annualized return did my actual money earn?
XIRR takes the same basic idea as IRR but uses the actual dates of your cash flows. Maybe you invested $10,000 five years ago, added $500 every month, dumped another $10,000 into the market during a crash and occasionally withdrew money. Those dollars were not all invested for the same amount of time. XIRR uses the amount and exact date of every cash flow and calculates the annualized return actually experienced by your money. So while IRR works with regularly spaced periods, XIRR uses the actual calendar dates. Both are forms of money-weighted return, but for an individual investor who is constantly adding and removing money, XIRR is often much more useful. It answers a very simple question: What annualized return did my actual dollars earn?
TWR: How did the portfolio itself perform?
Time-Weighted Return takes almost the opposite approach. Instead of allowing your deposits and withdrawals to influence the result, TWR removes their impact. That makes it useful for evaluating how the investments or portfolio manager performed regardless of when you personally decided to add or remove money.
A simple way to think about it is:
XIRR asks: How did my money perform?
TWR asks: How did the portfolio perform?
Two investors can own the exact same investments and have the same time-weighted return while having very different XIRRs because they contributed money at different times. One investor might have added a huge amount right before a market crash. Another might have added that same amount near the bottom. Same portfolio, same investment performance, but very different personal experiences.
Real Return: How much purchasing power did I actually gain?
Then there is inflation. If your portfolio returned 7% but inflation was 3%, you did not really increase your purchasing power by 7%. Your real return was closer to 4%.
And you can keep going from here. You can look at:
After-tax return.
Risk-adjusted return.
Sharpe ratio.
Sortino ratio.
There are dozens of ways to slice investment performance depending on what question you are trying to answer. The important part isn’t finding the one “correct” return number. It is understanding what question each return number is answering.
So when someone says: “My portfolio returned 20%.”
The finance-nerd response is: 20% measured how?
Price return? Total return? CAGR? IRR? XIRR? TWR? Real return?
They are not necessarily competing answers. They are different statistics answering different questions about the exact same investment. And sometimes the difference between looking like an investing genius and looking completely average is simply which return statistic you decided to quote.