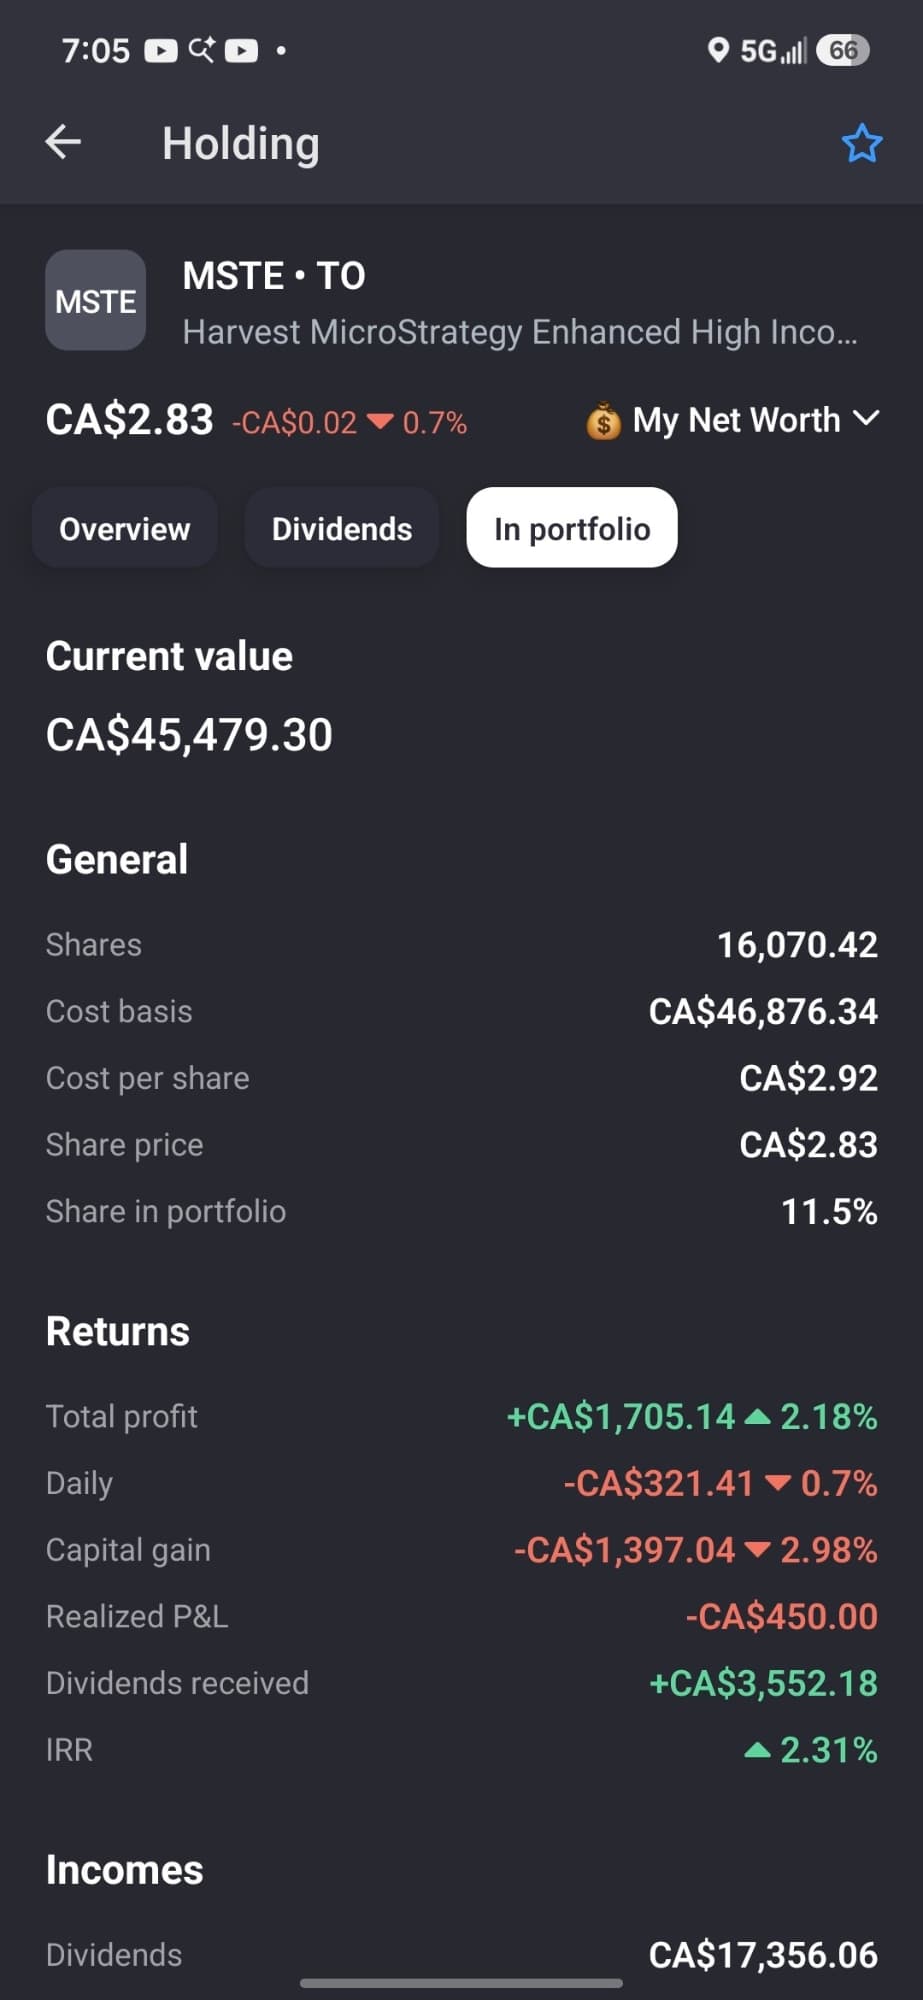
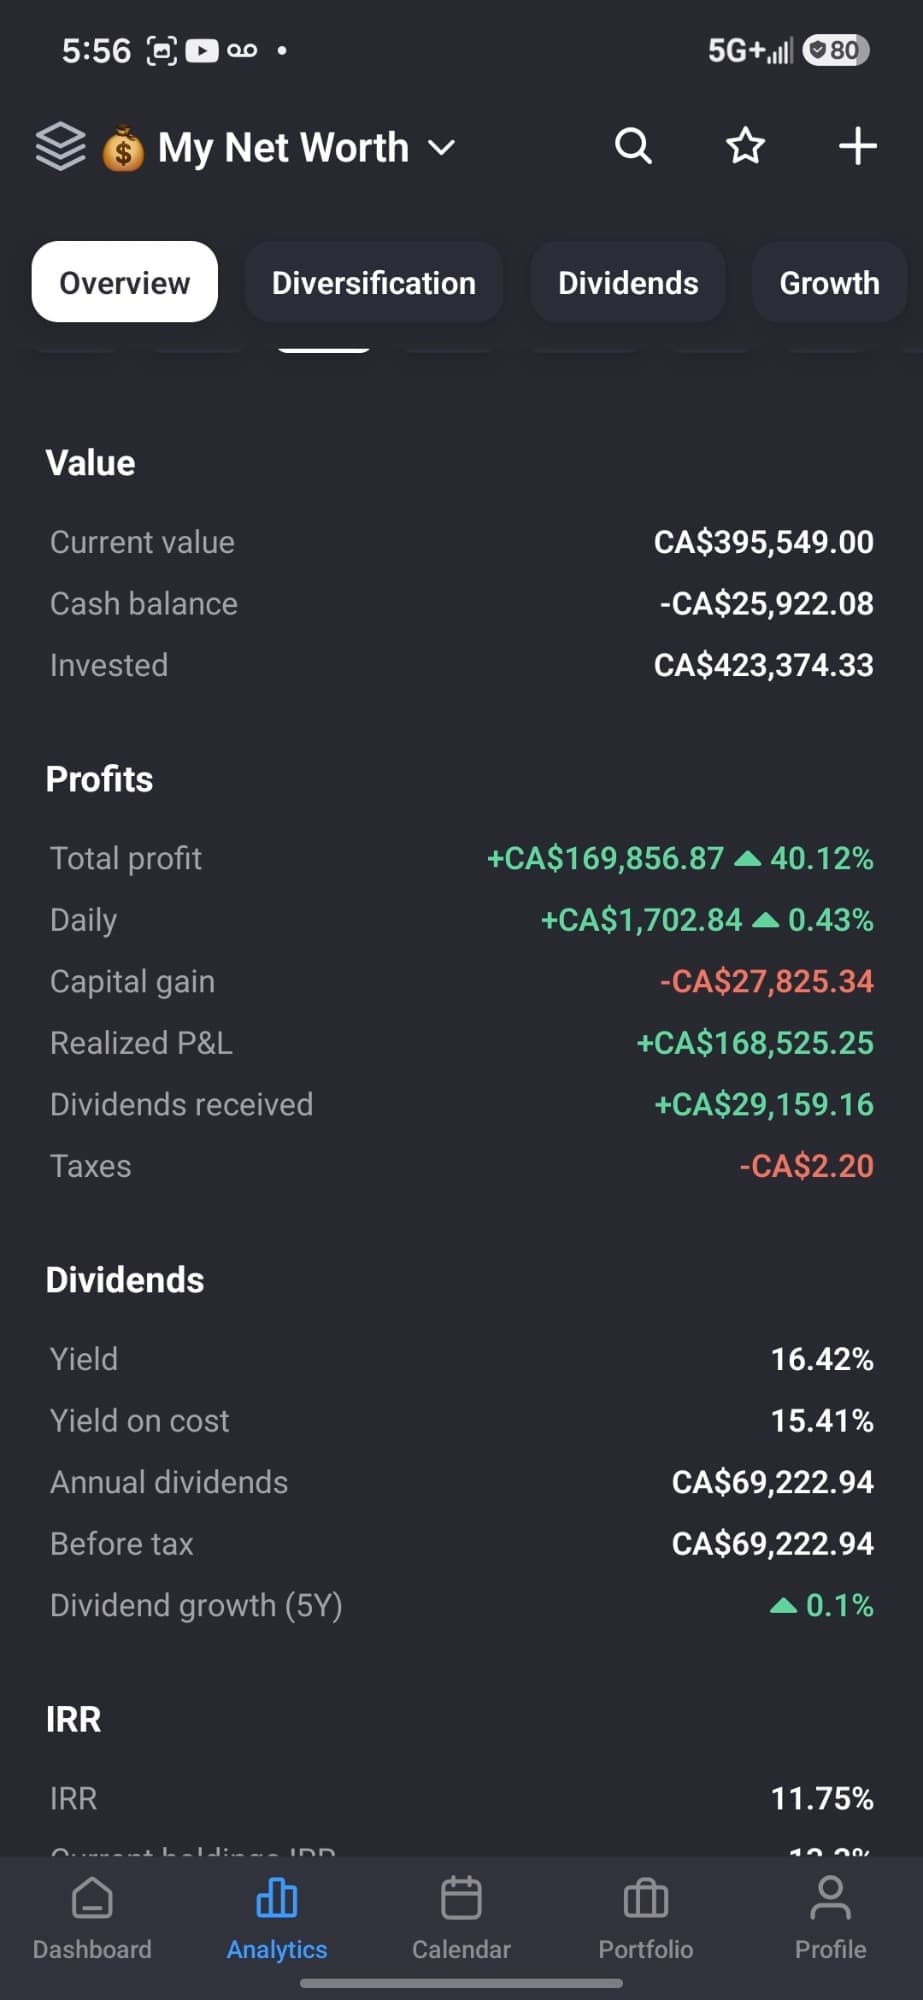
For those following $BTC / $FBTC / $MSTE / $BDAY : And “Uptober,” as folks in the Bitcoin community often call October because of its historically strong seasonality, is finally here! 🙂 At this point, my personal read is that the discussion about Bitcoin making a new cycle low below ~$58K has become considerably less likely. Based on the price structure we've seen since then, I increasingly believe the ~$58K–$60K area a few months ago may have marked the bottom of this correction/cycle phase. Of course, Bitcoin doesn't follow a script, and the often-discussed ~4-year Bitcoin cycle is a historical pattern rather than a guarantee of what comes next. On my Sep 22 update, I wrote: “After yesterday’s breakout from the low-$80Ks and a move as high as roughly $87.3K, Bitcoin spent most of today hovering around $85K–$86K... That's a genuinely encouraging sign for this momentum!” Well… here we are again. 🙂 Bitcoin has made another run toward $87K, but I think what has happened between Sep 22 and today is quite interesting. After the previous move toward ~$87.3K failed to continue higher, BTC pulled back and spent several days consolidating primarily in the $82K–$85K area, instead of collapsing back toward the mid/high-$70Ks, buyers continued showing up and BTC eventually rebuilt momentum toward $85K. Periods of pullback with consolidation are extremely healthy and great for long term growth. Some sources like Glassnode (glassnode.com) identified approximately $85K–$85.5K as an important “sell wall” (cluster of folks with sell orders in range), but over the last 24 hours, buying pressure absorbed enough of those sell orders — while some asks appear to have been repositioned higher — allowing BTC to break through $85K and quickly push back toward $87K. At the same time, U.S. spot Bitcoin ETFs recorded approximately $103M of net inflows Thursday, led by roughly $196M into BlackRock's IBIT. That came immediately after the previous ETF inflow streak had been interrupted, while 30-day net inflows are now around $3B, In simple terms, people and institutions continue putting more money into Bitcoin related ETFs than they are taking out. 😉 So, compared with my Sep 22 update, I think we're getting an interesting second attempt: · Sep 22: ~$87.3K → rejection → consolidation · Oct 2: $85K wall breaks → ~$87K retested → now pulling back toward ~$85K But compared with Sep 22, we now have almost two additional weeks of price action showing BTC repeatedly defending the low-$80Ks and returning to challenge the upper end of the range. --- Price Ranges I Am Watching --- · ~$85K–$85.5K — Current level, key breakout/retest zone · $84K–$84.5K — secondary support, if price falls · ~$82K–$83K — structural support, if secondary support fails · $87K–$88K — immediate resistance, if buyers show up and price goes up · $90K — major psychological level if BTC can eventually establish itself above $88K What I would actually like to see next is pretty boring: Break $85K → test $87K → cool off → hold ~$85K (we are currently kind of here) → attack $87K/$88K again in a couple of days. • If that happens, BTC would be doing something it didn't manage to do after the Sep 22 move: turning the ~$85K area from resistance into a support zone. That's why I'm not interpreting today's pullback from ~$87K toward ~$85K as bearish by itself. • If ~$85K holds and BTC makes another run at $87K–$88K, the technical case for eventually testing $90K becomes more plausible. • If $85K fails, I am expecting that we would fall back to the previous price range move back below the broader $82K–$84K area --- What appears to be weighing against Bitcoin --- • U.S. Treasury yields remain exceptionally high. This remains my #1 macro concern. The U.S. 10-year reached approximately 5.34% yesterday — its highest level since 2002 — and remains above 5% today despite considerable volatility following the jobs report. • The global bond problem isn't just American. Government yields across the U.S., Europe and Japan have reached multi-decade highs. • Japan/yen carry-trade risk hasn't disappeared. Japanese yields have risen significantly, and expectations around BOJ normalization remain a potential source of volatility. • Inflation remains too high for the US Fed's comfort. August inflation was around 3.4%, and the Fed raised rates in September. • Oil remains dangerously high because of the U.S.–Iran conflict. Brent recently moved above $100 amid Middle East escalation and has pulled back toward ~$100 following plans for coordinated releases from strategic reserves. --- What appears to be propelling Bitcoin higher --- • Institutional/ETF demand has returned strongly. • The $85K–$85.5K sell wall was breached • Today's weak U.S. jobs report helped the liquidity/rates narrative. Payrolls increased only ~29K versus ~90K expected and unemployment rose to 4.2%, significantly reducing market expectations for another Fed hike in October. • U.S. regulatory conditions continue gradually improving outside Congress. This is an interesting new factor. The SEC proposed a tailored crypto-custody framework for registered investment advisers and regulated funds this week, potentially reducing another institutional-adoption obstacle. That's only a proposal • And above all, despite substantial macro and geopolitical headwinds, buyers continue to show up at important technical levels. To me, BTC's ability to repeatedly recover while yields, inflation and geopolitical risks remain elevated is one of the more constructive aspects of the current price action. --- Risk Management --- As prices have moved considerably over the last few weeks, I am revising my "personal technical reference" points. For investors who use or wish to use stop orders as part of their own risk-management strategy, one approach is to place the trigger below "structural support" price rather than directly underneath the current price, allowing room for normal Bitcoin volatility. - The levels below are simply the reference points I am currently considering for my own risk management, not recommendations. Stop-limit orders also carry execution risk: if price gaps below the limit price, the order may not execute. – This is NOT financial advice If you are new DIY investor, you may wish to engage your broker documentation, do your own research or leverage your preferred AI tool for assistance to better understand “stop loss”. For $BTC (illustrative, not personalized advice): - Stop price: US$82,200 ≈ C$117,000 - Limit price: US$81,800 ≈ C$116,500 For $MSTE (illustrative, not personalized advice): - Stop price: C$2.58 - Limit price: C$2.50 For $FBTC (illustrative, not personalized advice): - Stop: C$38.20 - Limit: C$37.90 For $BDAY (illustrative, not personalized advice): - Stop: C$29.60 - Limit: C$29.00 --- Technical Analysis --- What makes me more constructive today isn't simply that Bitcoin touched ~$87K again. There are now several layers of technical support underneath the price. Below my shorter-term technical levels, Glassnode identifies the True Market Mean around ~$77.2K as an important broader on-chain support reference. A sustained move below that area would represent a much more significant deterioration in the current structure. • $85K–$85.5K — the immediate test: This was previously a significant resistance/sell-wall area. BTC has now broken through it and is pulling back toward it. If buyers continue appearing around here, we could be watching a classic resistance → support flip. This is the most important level for me right now. • ~$84K–$84.5K — moving-average support: The 4-hour 30-period moving average is around $84K, giving BTC another layer of dynamic support underneath the breakout area. This also overlaps with the consolidation zone BTC repeatedly traded around before this latest move. • ~$82K–$83K — structural support: This is where BTC repeatedly found buyers during the consolidation following the Sep 22 move. The recent 4-hour swing low was around $82.6K, making this a much more important line in the sand if the $85K retest fails. • ~$80.5K — major trend support: The 4-hour 200-period moving average sits around $80.5K and continues rising. BTC trading well above the 200-MA is another indication that the broader short/intermediate-term structure has improved considerably. Momentum supports that picture as well. The 4-hour MACD remains strongly positive, meaning the larger move still has upward momentum even though the 15-minute MACD has turned negative during today's pullback. ---Disclaimer --- • Although I hold $MSTE , it is important to highlight that MSTE adds another layer of risk on top of $MSTR through approximately 25% leverage and covered calls. Leverage can amplify both gains and losses. Weakness in MSTR can therefore put additional pressure on MSTE's NAV, while a sustained MSTR recovery can have an amplified positive impact on NAV. • Regarding $BDAY , it is important to highlight that it is composed of ~100% exposure to Bitcoin (via $IBIT ) plus roughly 25% exposure to the Nasdaq 100 (via $QQQM ), funded through modest ~25% leverage, and it employs an actively managed, primarily ultra-short-term (0DTE) options strategy on the $QQQM portion of the portfolio. • This post was created with assistance from AI tools including ChatGPT, Claude and Gemini and based on publicly available market, ETF-flow, macroeconomic and fund information. It is for informational and discussion purposes only and is NOT financial advice.
1,512 views
3 Comments
Yves
@panther1963 · 19d
And when Mste pays me crazy monthly distributions, I'll take half of them to buy my etfs that I neglected for 3 years.
Yves
@panther1963 · 20d
I'm starting to funnel all my distributions into Mste. Will probably do so the next 3 years on top of my weekly buys of $600. Hopefully i will accumulate over 150k shares in that time.
See the full comment section 👀Sign up for the full Blossom experience!