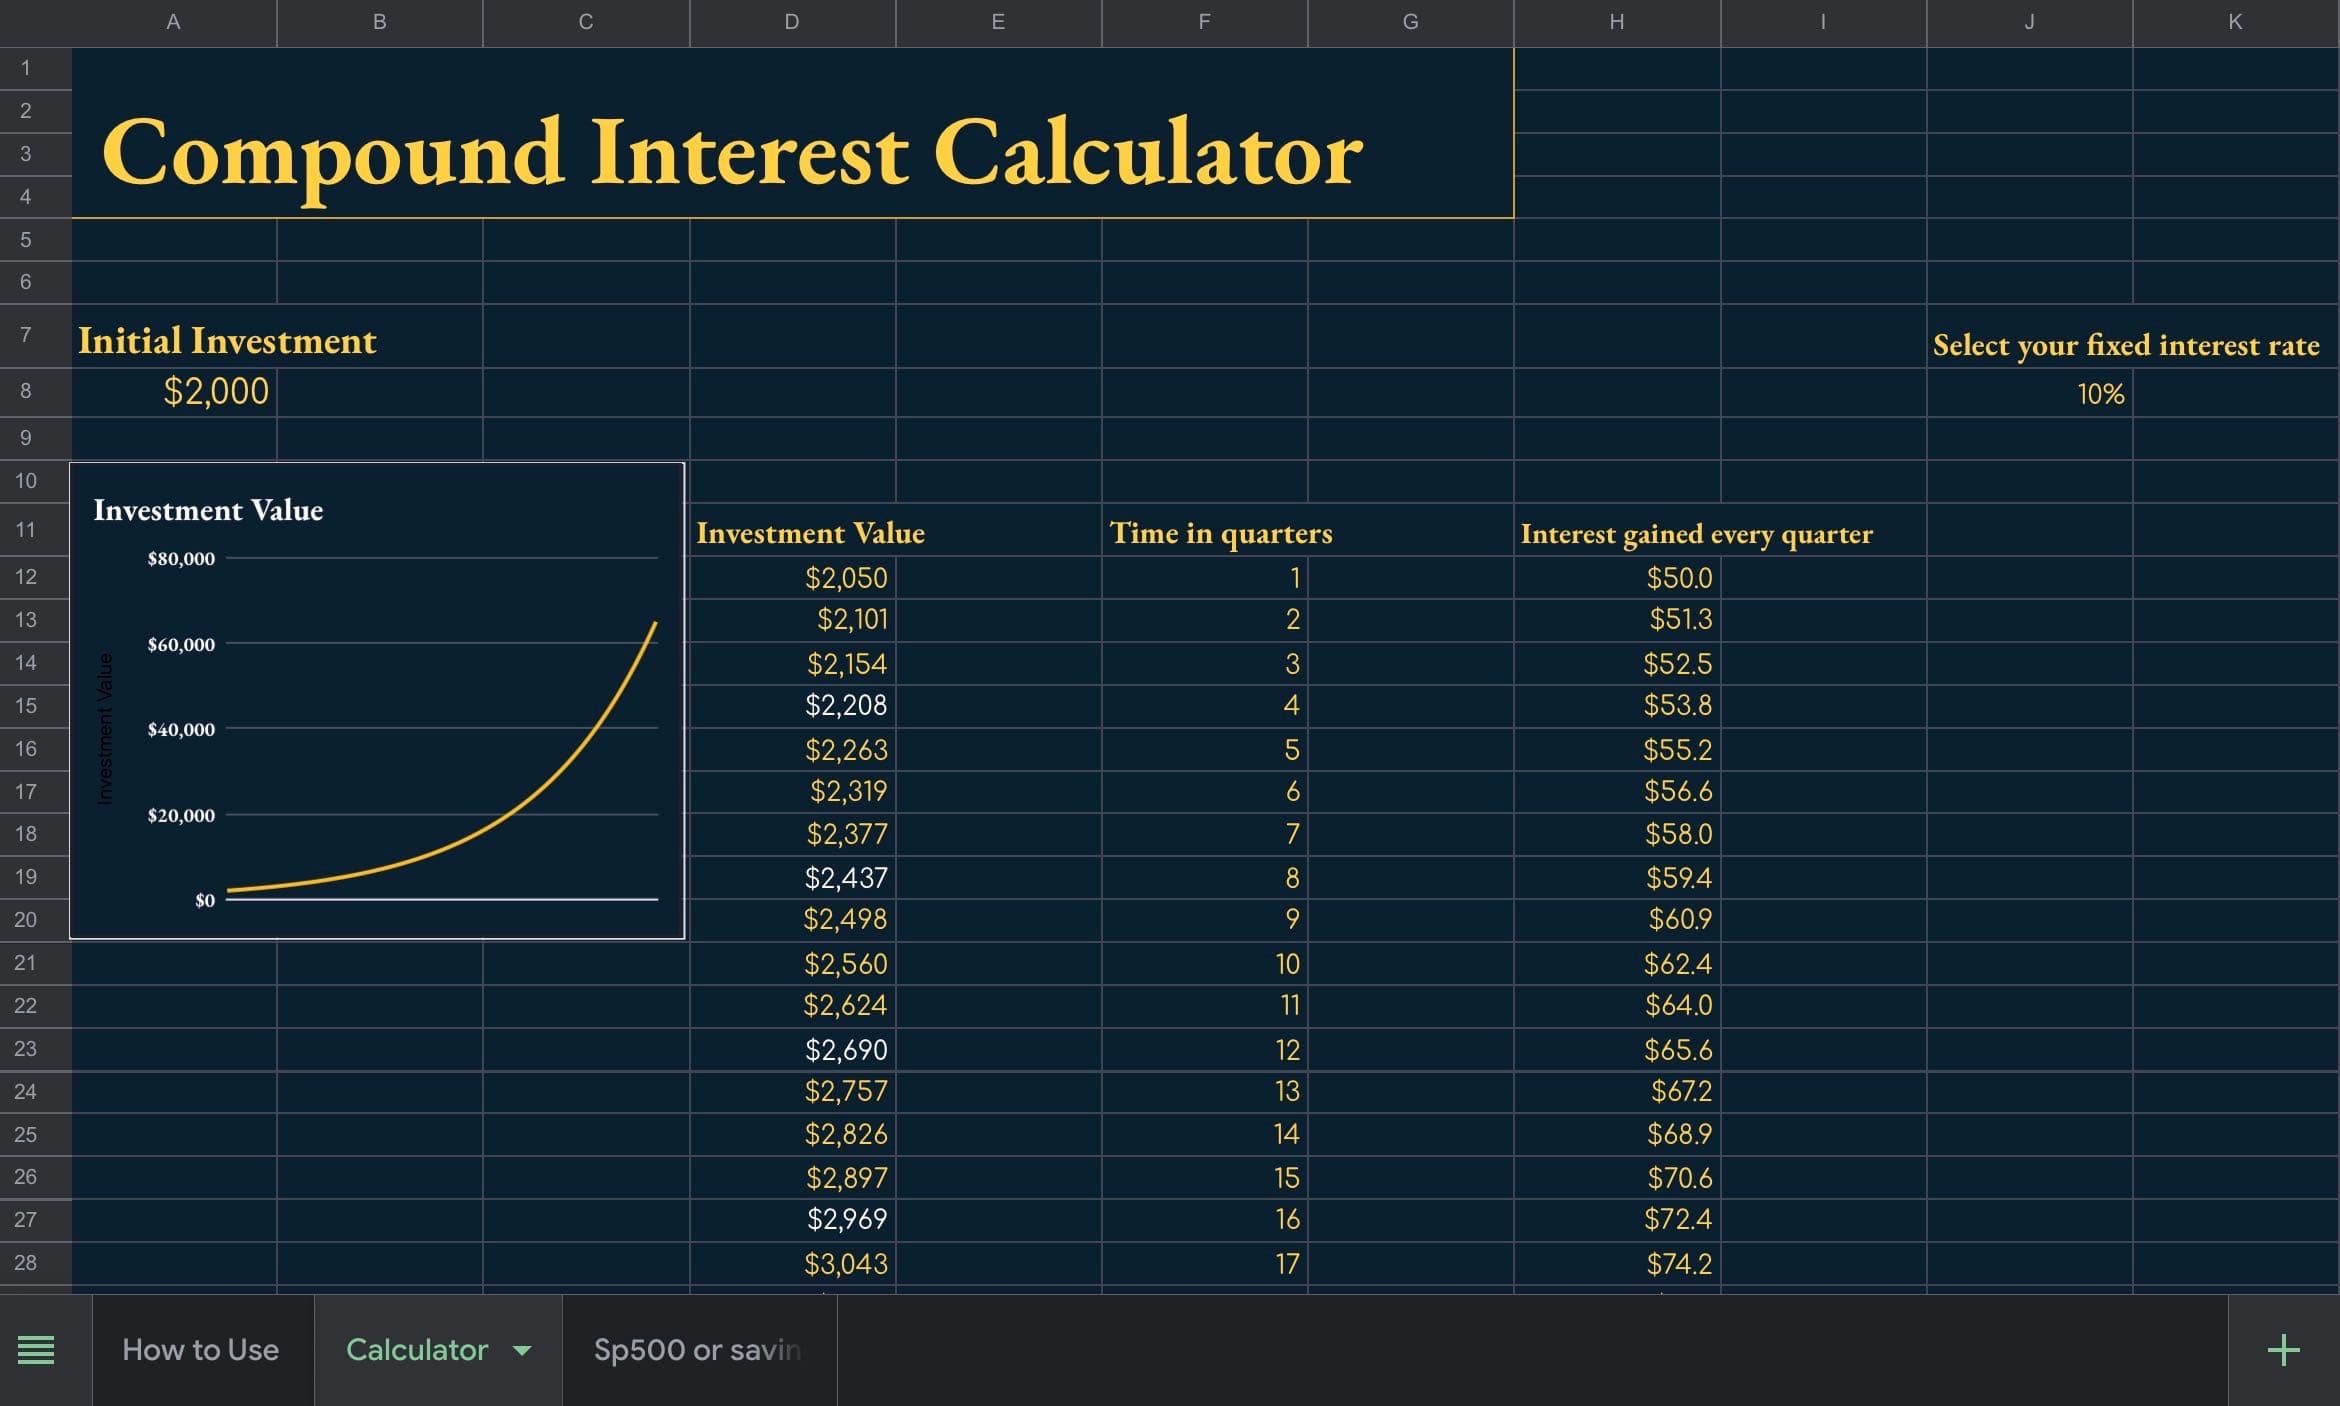
How I track long term compounding
When deciding where to park capital, the biggest mistake is not visualizing the long-term opportunity cost. A 3% yield in a savings account feels safe today, but how does it stack up against a historical 10% market index over three decades?
I built a forecasting spreadsheet using an "X Interest Rate" input so I could compare investments using the exact same principal amounts.
It automatically calculates the investment with a fixed rate (like a savings account) and a compounding equity rate (like the S&P 500) for 30+ years.
Seeing the raw numbers automatically makes it incredibly easy to map out a balanced risk-to-reward allocation for long-term horizons.
Thanks for reading!
The Spreadsheet is linked directly in my profile bio.