How a 1.9% Bank Fee Stealthily Erases $264,000
👥 Two Friends, Two Very Different Retirements
Meet John and Nancy.
Both start investing at age 25.
Both contribute exactly $200 a month until age 65.
Both put in exactly $96,000 of their own hard-earned money over 40 years.
They invested in the exact same equity market, which grew at an average of 8.00% gross annualized.
So why is one of them $264,000 poorer at retirement?
📉 John: The "Standard" Bank Mutual Fund
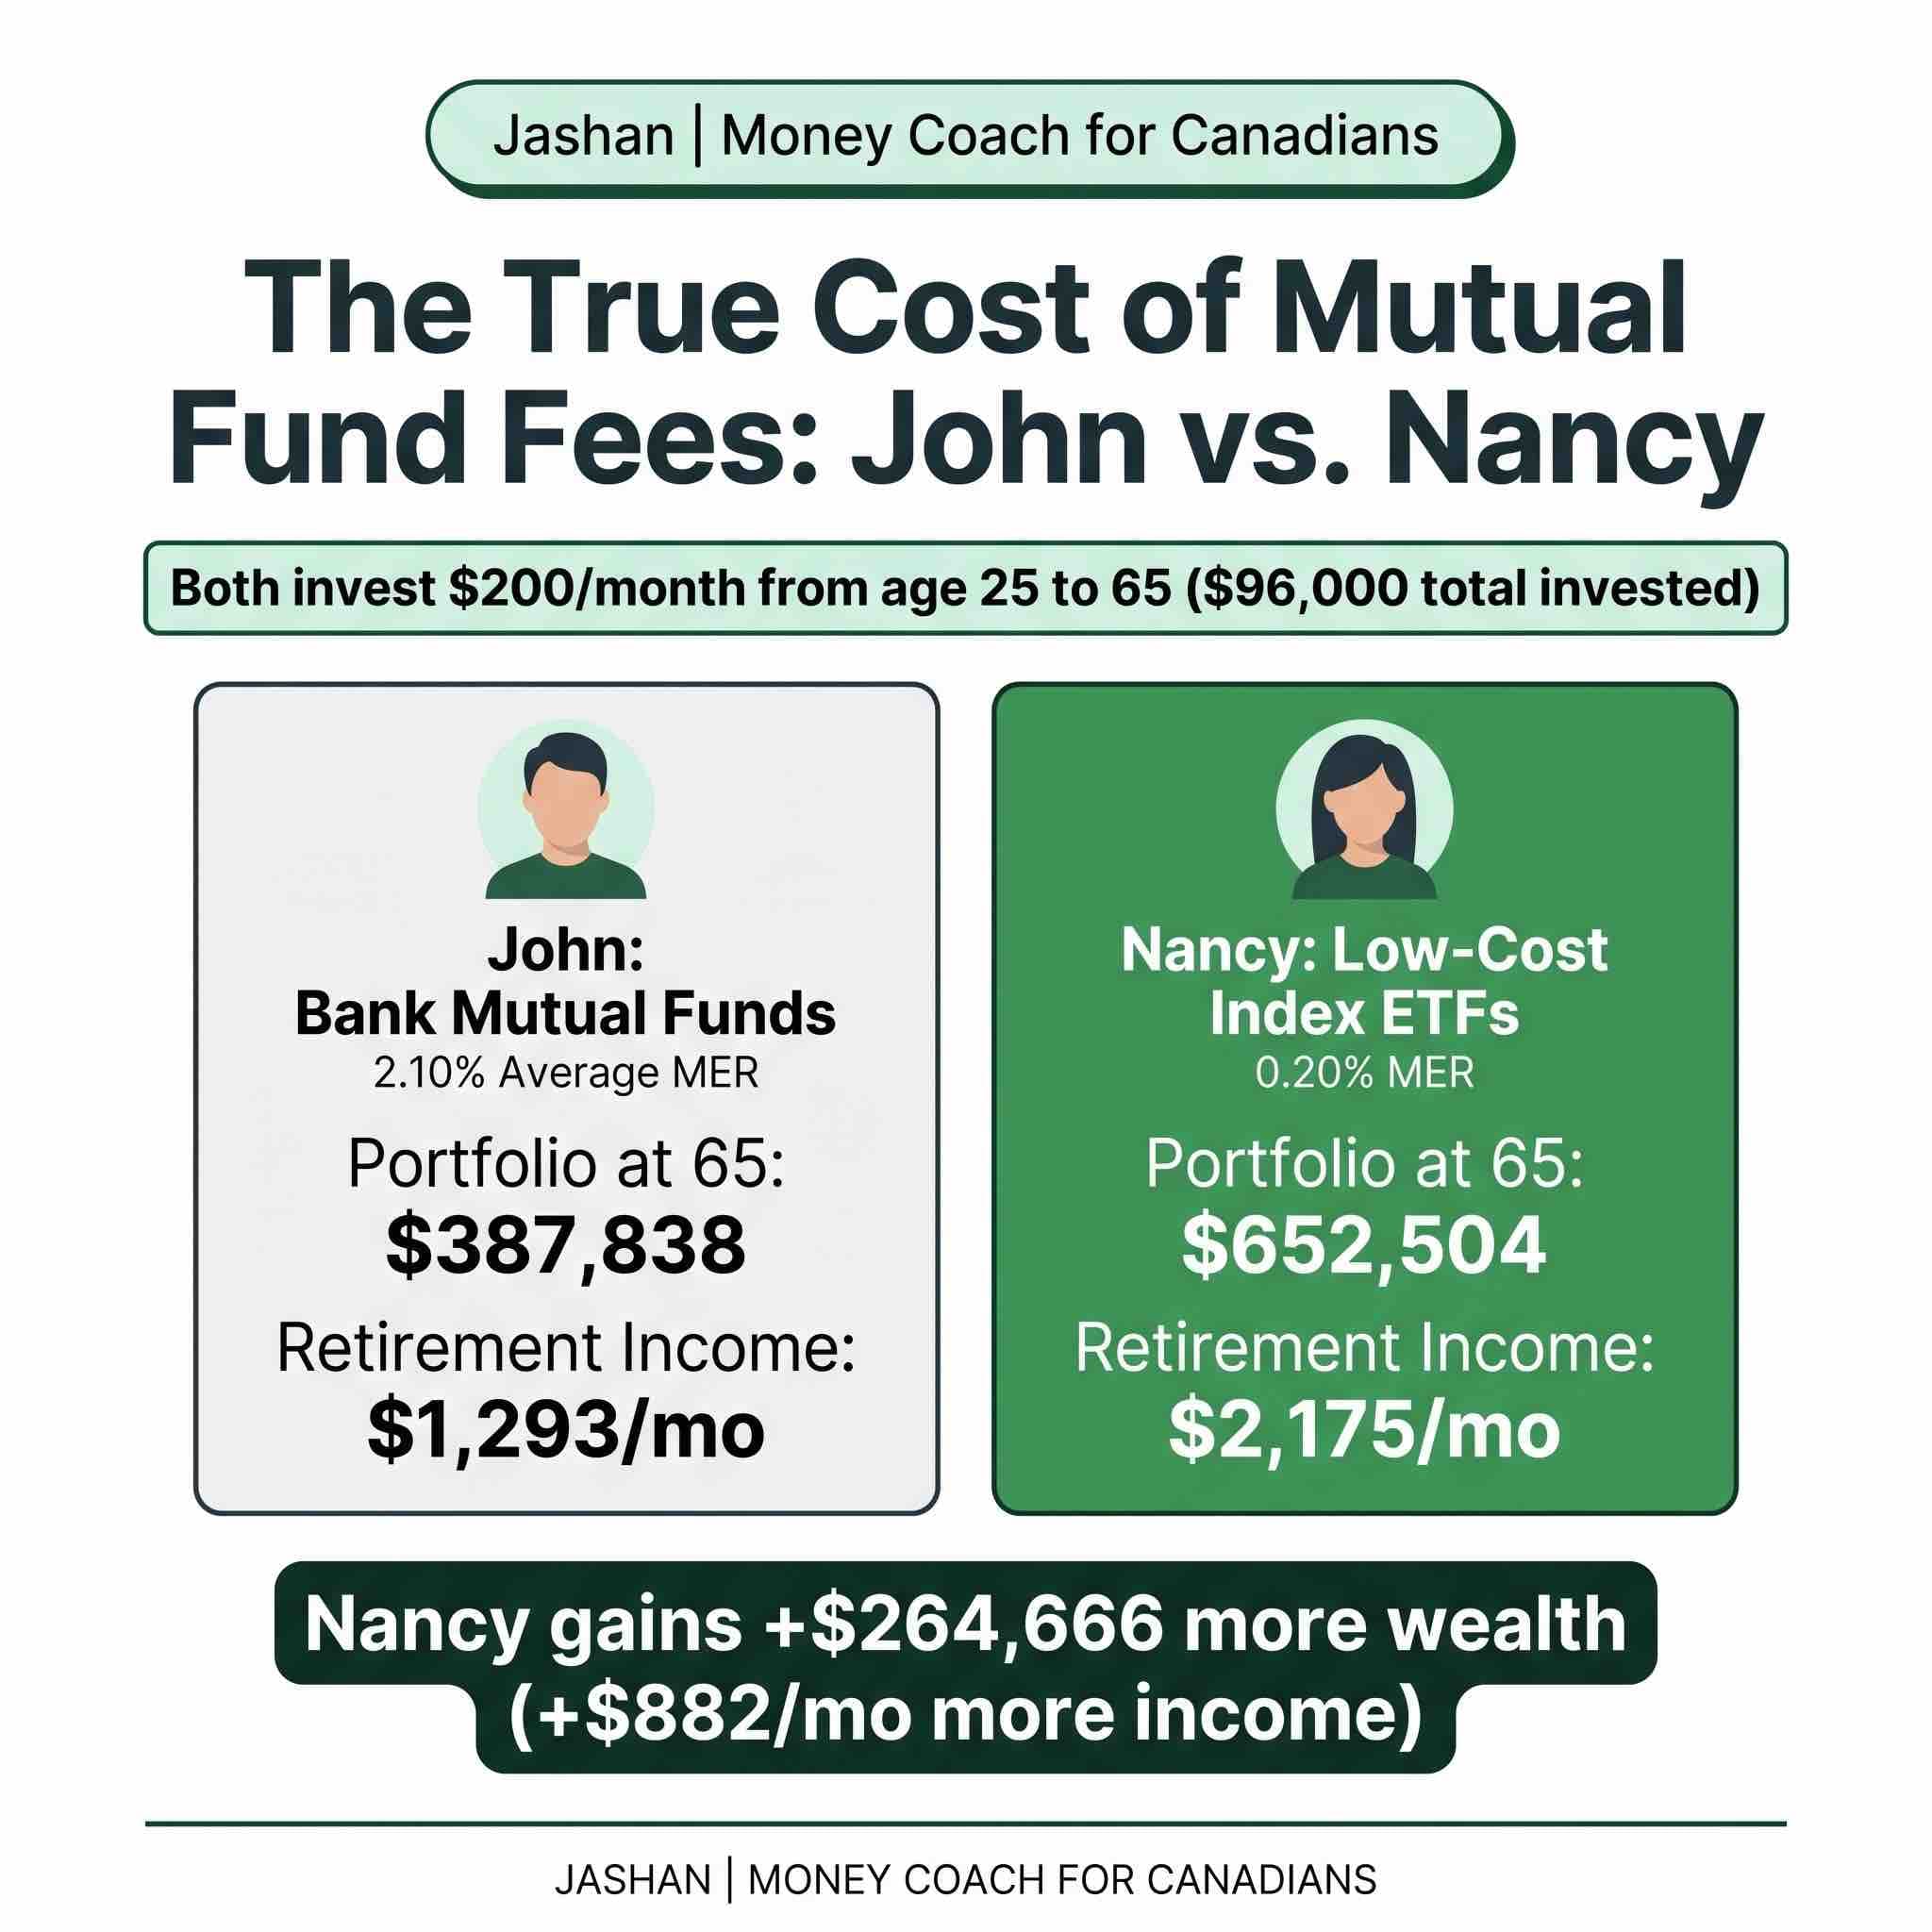
John went to his local branch and was sold an average Canadian equity mutual fund with a 2.10% MER.
Net Annual Return: 5.90% (8.00% minus 2.10% fees)
Final Nest Egg: $387,838
Est. Monthly Income (using SWR 4% rule): $1,293/month
🚀 Nancy: The Low-Cost Index ETF
Nancy went the DIY route, using a self-directed account to buy a broad-market index ETF with a 0.20% MER.
Net Annual Return: 7.80% (8.00% minus 0.20% fees)
Final Nest Egg: $652,504
Est. Monthly Income (using SWR 4% rule): $2,175/month
📊 The Brutal Math
Because of a seemingly tiny 1.90% difference in fees:
• John lost 40% of his entire potential nest egg to the bank ($264,666).
• Nancy gets $882 more every single month to spend in retirement.
It wasn't because Nancy worked harder, saved more, or picked better stocks.
She just didn't pay the bank to do what she could do herself for next to nothing.
💡 The Nuance
Of course, this assumes both reinvested 100% of dividends and that tax drag remains equal (e.g. within a TFSA or RRSP).
It also relies on standard nominal SWR metrics.
However, even with inflation or taxes, the fee-percentage relationship remains devastatingly constant.
Small numbers over 40 years are massively amplified by compounding.
If you wouldn't give away 40% of your paycheck to an advisor, you shouldn't let them take 40% of your future.
What age were you when you realized how destructive MERs could be, and did you immediately move your funds out of traditional mutual funds?