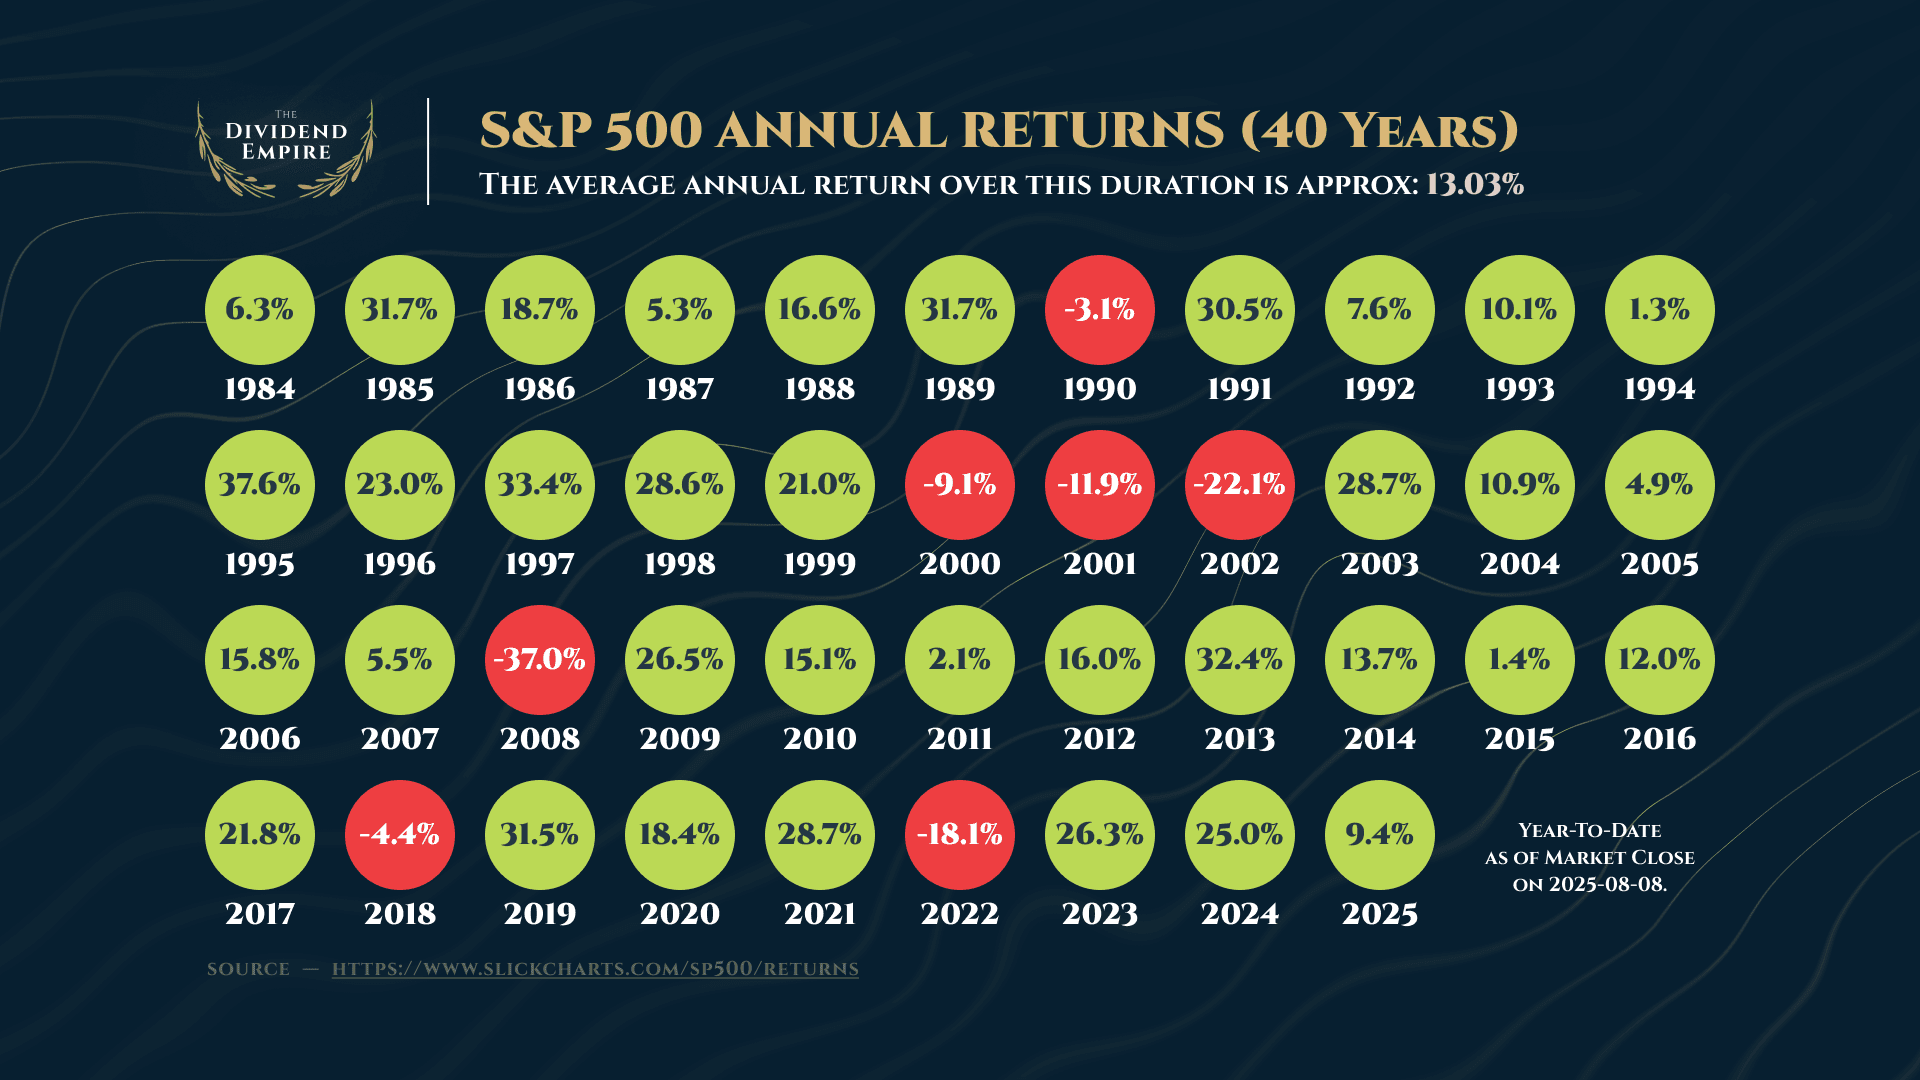
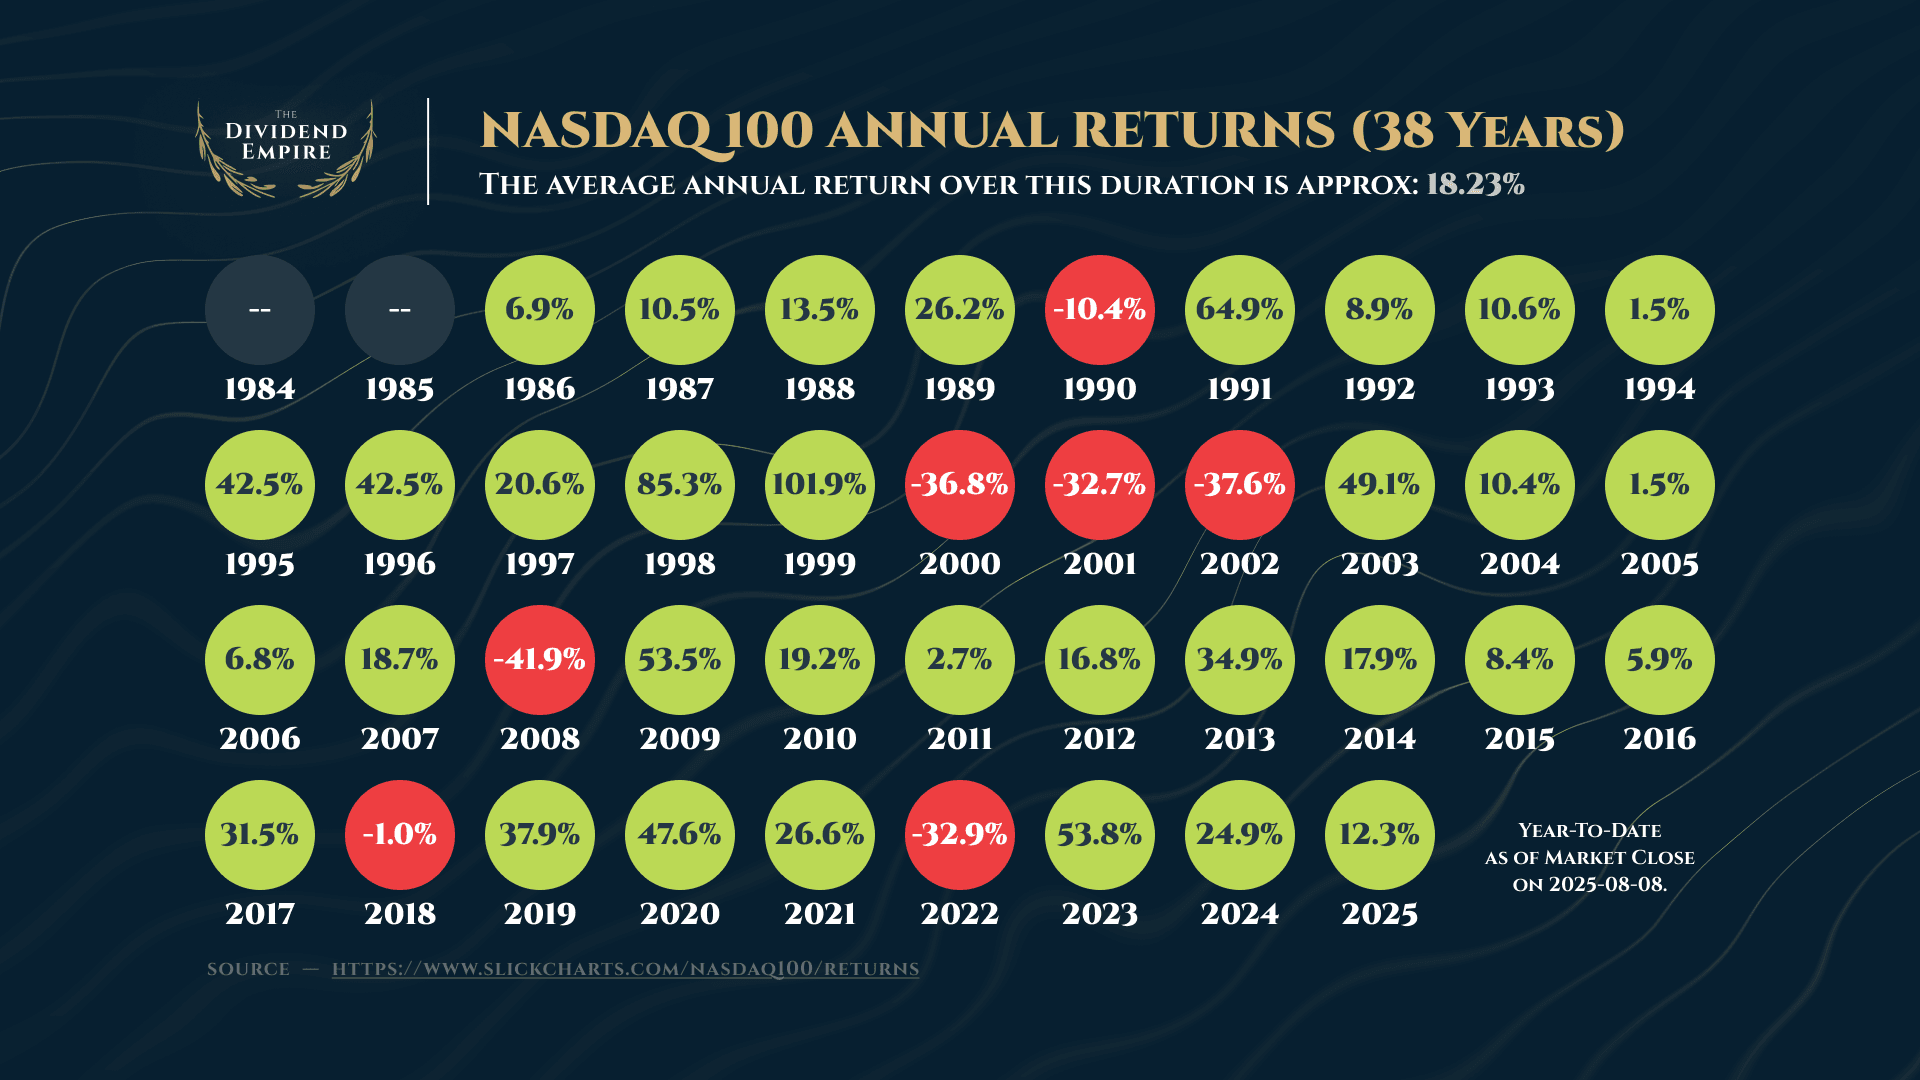
I shared this infographic a few months back when the entire market was tanking and in the red.. but here we are now with it flipped and the markets are now greatly in the green again! 🟢 📈 S&P 500 is +9.4% YTD The average return for the S&P 500 over the 40 years has been ~13.03% 📈 Nasdaq 100 is +12.3% YTD The average return for the Nasdaq 100 over the 38 years has been ~18.23% We've just entered into August and have 5 more months left in the year, given the context above where do you think we'll end up? Will we go up another +3.63% in the S&P 500 to meet the average? And for the Nasdaq 100 another +5.93%? Or is it that we will once again see another year of 20%+ returns? 🫨🚀 ➡️ Everyone is eyeing potential rate cuts in the U.S. next month which could push markets up higher, and so far this earnings season has proven to be quite strong. And for the bears.. are we on the way back down?! 🐻🔴 ➡️ We've basically been on an upward only trajectory since April now, have the markets become too frothy or overvalued? Comment with your thoughts down below! 👇🏻 .
4,526 views
30 Comments
Catherine
@ffcatherine · 1yr
Choppy August with a dip in August or September & bounce back after the next rate cut announcement
Russ Knopf
@rustyram78 · 1yr
Theoretically the upside is unlimited, right?
John Crivici@djfc1990 · 1yr
Let see what the US job numbers are like end of August… unless the idiot of the Oval fudges with the statistics … need a reason for the markets to correct… and Tyu for posting
Andrew T
@andt987 · 1yr
Probably a pullback in September then go back up once interest rate cuts happen
See the full comment section 👀Sign up for the full Blossom experience!