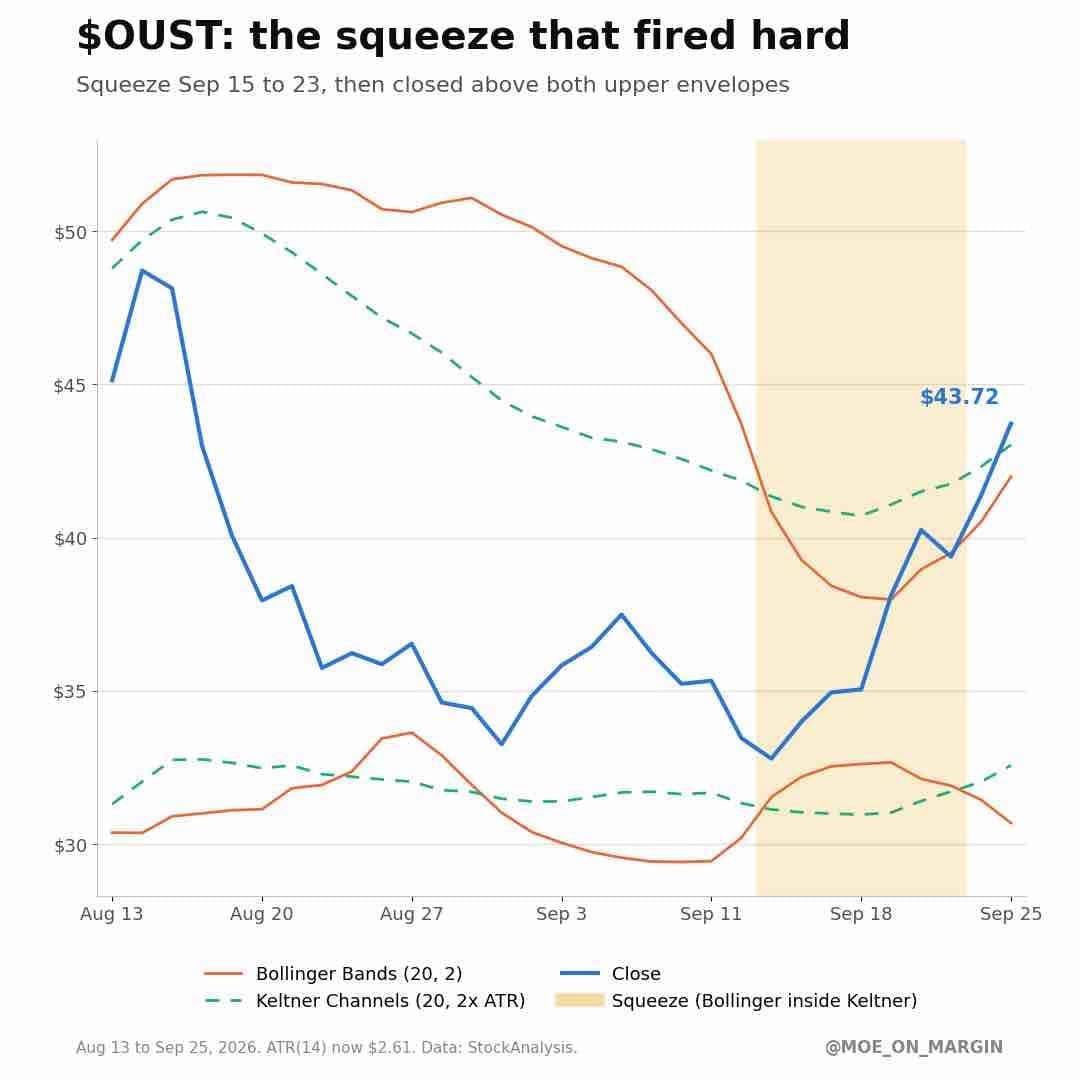
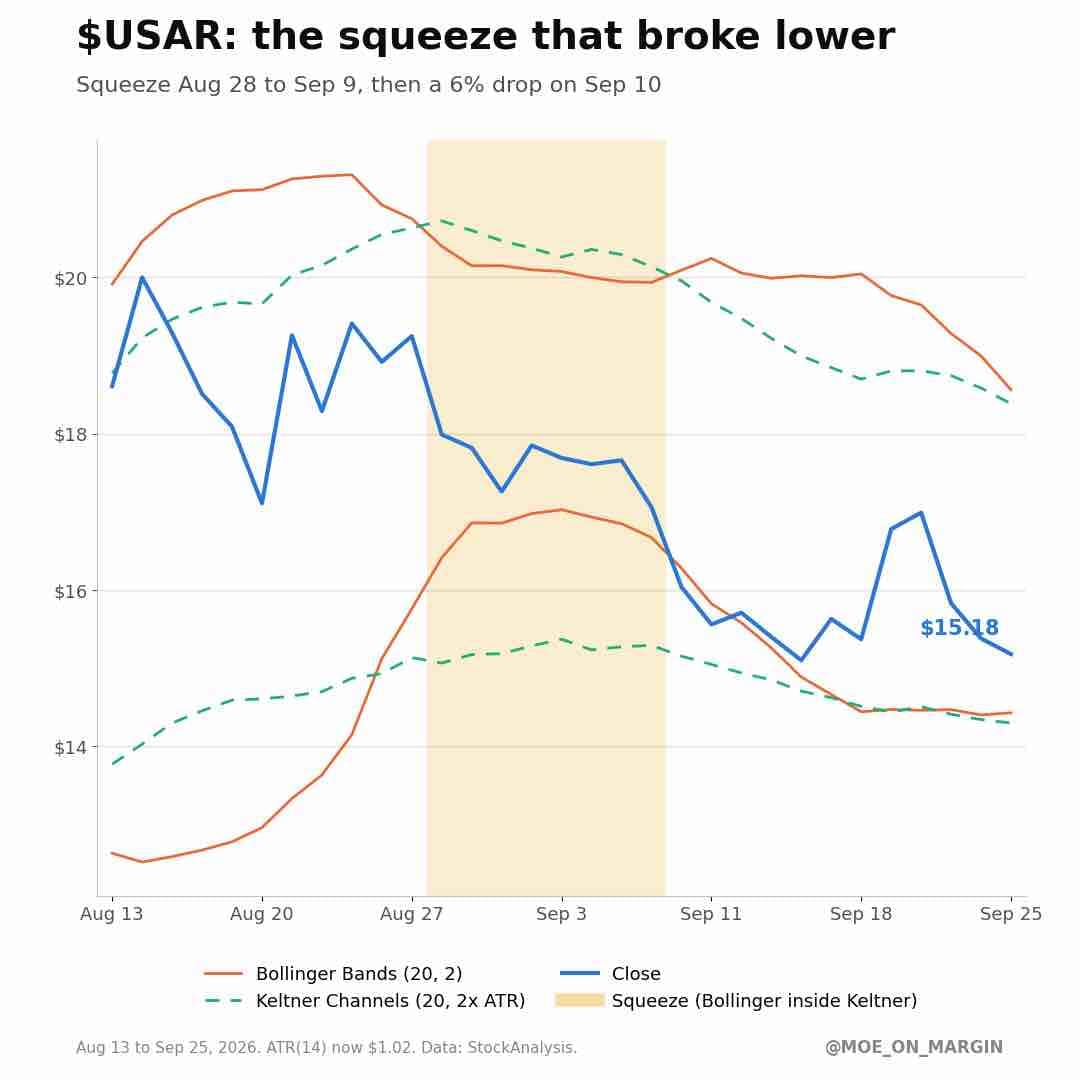
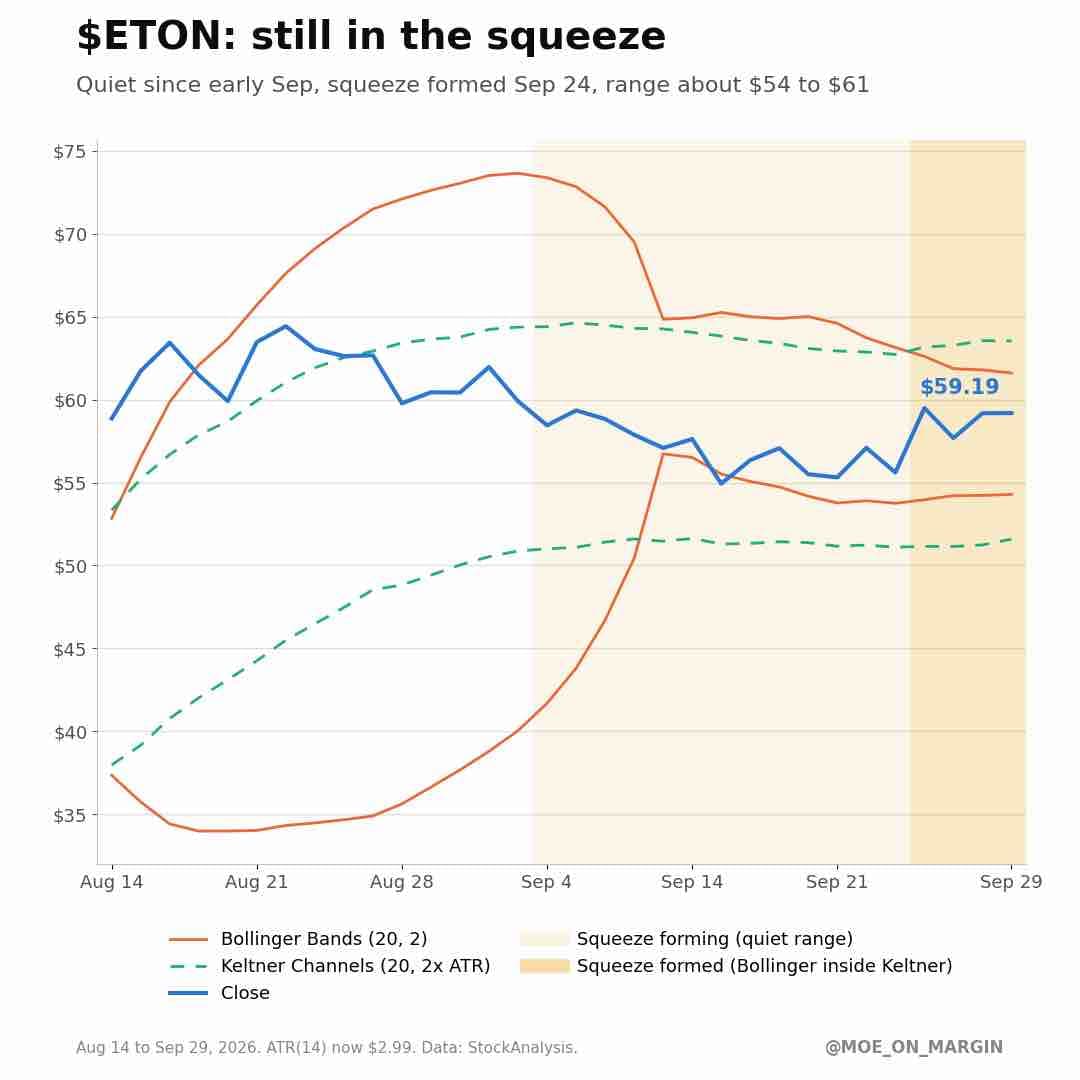
This week I started reading and learning something new, a topic to be honest I knew very little about... I'm experimenting with Bollinger Bands and Keltner Channels two volatility indicators that can signal that a big move on price is coming (squeeze). And the only way I know how to learn something is to apply it in real-life, so I used 3 of my favorite holdings $OUST$USAR$ETON to plot the graphs below covering their movement in Aug-Sep. These tools basically measure volatility of closing price over a period of time (Bollinger) and daily range of price movement (Keltner) by drawing an envelope around price movement with an upper and a lower edge. Once one of them shrinks (Bollinger) inside the other (Keltner) that's your signal a squeeze is building and a bigger move in the stock price can be expected. The one limitation is a squeeze only tells you a move is coming, but gives you no direction which way the price moves up or down. You'll see below both $OUST and $USAR had the same signal, but went in opposite directions. So, you need to do some digging to uncover how the squeeze will go separately, by looking at things like upcoming earnings results, option flows, or checking any upcoming big catalysts/deadlines. Now for some show and tell with all 3 examples I used showing a squeeze forming during Aug or Sep: $OUST Squeezed from Sep. 17-23 then rallied 5.1% and 5.7% back to back jumping up to 43.7 and closed last week above both upper envelopes which is a very strong breakout from the squeeze in the positive upwards direction. $USAR did the exact opposite squeezed from Aug. 28- Sep. 9 and then dropped 6% the next day. Closed last week at $15.1 sitting near the bottom envelopes and its daily moves are now smaller. $ETON is the most interesting right now because it is still in the squeeze. The bands have been in a tight formation since the August earnings and it keeps trading between $54 and $61 waiting for the breakout in either direction. My read on ETON, knowing what's happened in previous quarter is that it will continue coiling until the next earnings date and the results ( which I hope will be another record quarter) will decide how it moves. Now something you can do with this information to make it useful knowing there is a squeeze coming, but unsure of direction... is to setup alerts for the top and bottom edges to notify you when the move starts to breakout so you can take action as needed. If anyone is interested to replicate this for their holdings I left the parameters of how I setup the graphs in the comments. Just learning and having fun, not financial advice and if you are an expert on the subject let me know how I did.
1,874 views
3 Comments
Moe
@moe_on_margin · 9d
- I used 20 day moving price average. - 2X standard deviation for example with ETON price average was roughly 57.95 and SD was $1.83 multiplied that by 2 and used +/- $3.67 for the upper and lower edges - for the Keltner Channels used 2X on the 14-day ATR so double the average daily price movement which for ETON as an example ATR was $3.03 and middle line $57.21 for upper and lower bands +/- $6.06
Marc
@rich1_1 · 9d
You should do this for mu earnings or BE
See the full comment section 👀Sign up for the full Blossom experience!