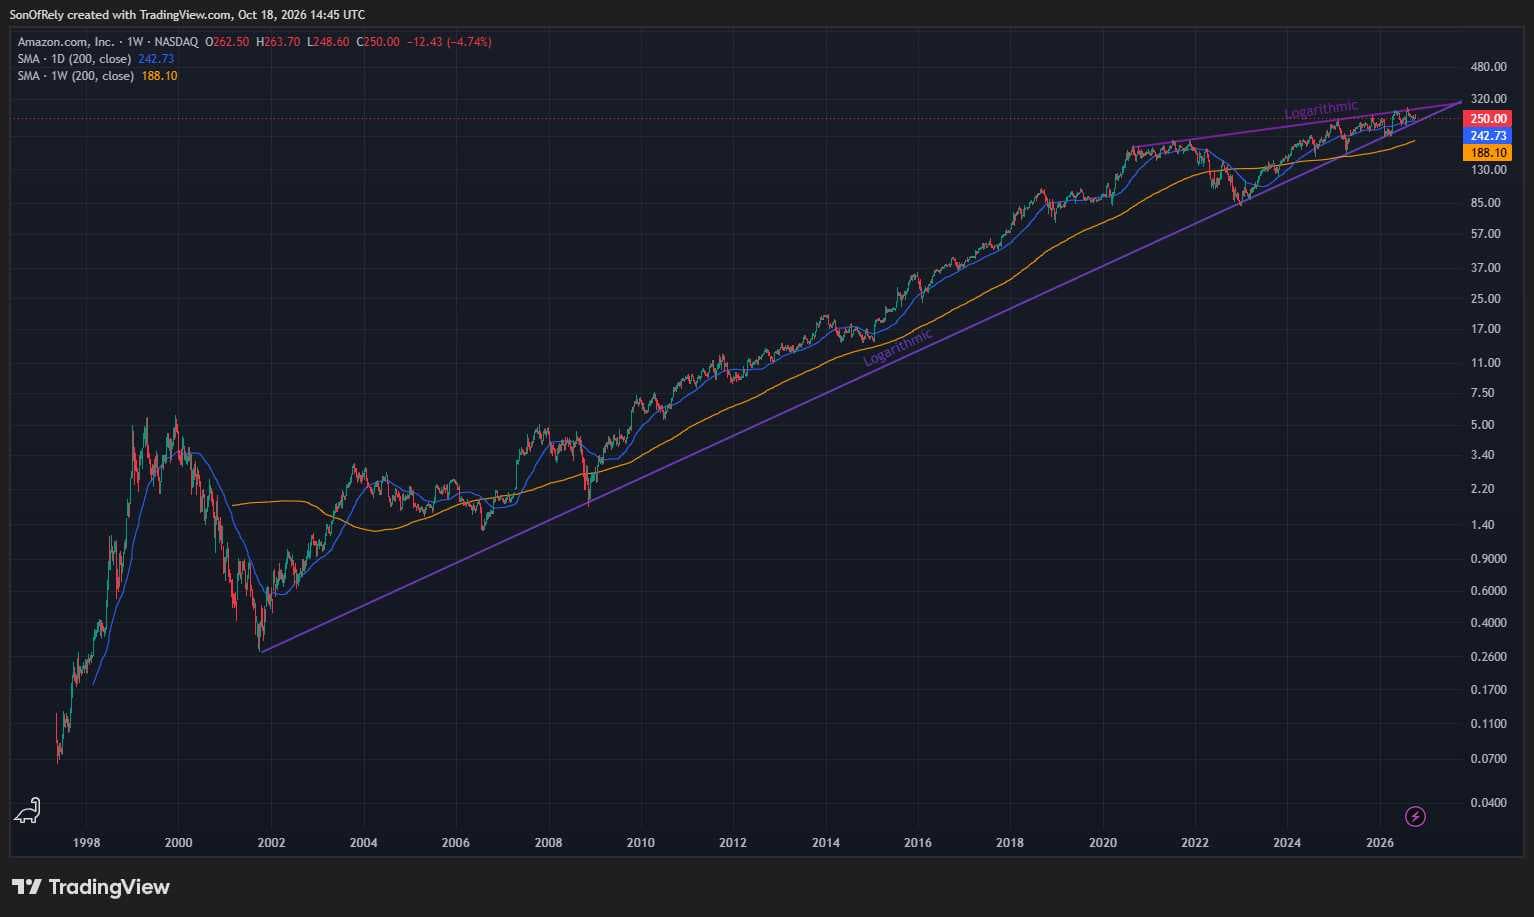
Still working on learning technical analysis based on Gareth Soloway's techniques, and I wanted to share the $AMZN chart. Now to be clear: I am at my core a fundamental-based investor, but I have started to use technical analysis to augment by decisions on when best to buy shares or trim based on valuation. With Amazon using a logarithmic scale on weekly candles, we can see that since it's currently being supported by its long-term support that has held since the Dot-Com Bubble. Unless a rapid change in fundamentals occurs or a serious macroevent occurs, it is unlikely support would break. Conversely, an upper support trendline created in 2020 has been repeatedly touched and is slowly narrowing. Pressure is building the false-breakouts in May and August 2026. With the company trading almost 25% below its 5 year average P/OCF (which is its best valuation metric while in its CAPEX cycle), I see a very strong risk-reward currently. Let me know if anyone has any questions or thoughts on this. Obviously not financial advise, and I am but a student of technical analysis at this time.
570 views
2 Comments
Nathan
@setao · 14d
I heard it once and it kind of stuck with me, “fundamentals tell you what to buy, technicals tell you when to buy”. I don’t trade NEARLY as much as I used to, much more conviction based “medium term” swings if anything, but technicals can still be an important part of investing. I don’t know a whole lot about pattern trading and whatnot, seems like horoscopes to me
Sheetal Rathore
@rathore1993 · 12d
Until mid last year Amazon was highest holding in my portfolio (not Linked in blossoms) approx 30%, diversified and reduced exposure to 10% Amazon. I am still believer of huge upside in next few qtrs
See the full comment section 👀Sign up for the full Blossom experience!