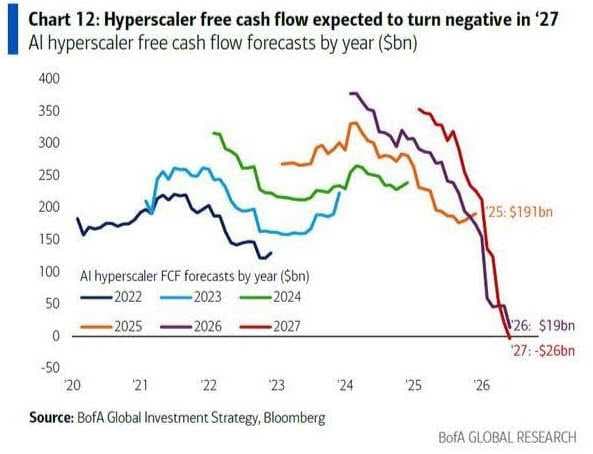
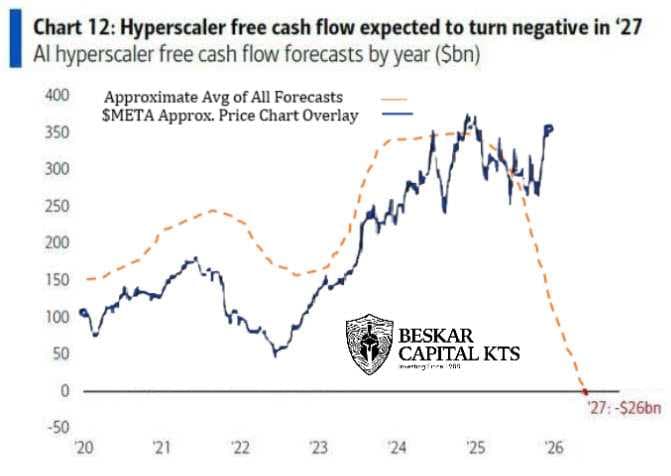
Originally published on Blossom on April 23th, 2024 Please find retrospective commentary at the end. Readers of KTS know that we frequently reference KTS #11 for understanding the differences between INSIDERS and INVESTORS. We accept that INSIDERS are the market makers. We also must accept our subservient role that we will follow the early INSIDERS and outperform most other INSIDERS and virtually all INVESTORS. If you have been following my posts/ trades, you’ve seen this in action by now with supporting details and profitable actions. So the aim of this series is to build our toolkit of investment strategies to learn to listen, read, and time the markets and the cycles to successfully – both consistently and sustainably – realize double-digit annualized returns. Early in this series, we provided a straightforward ETF only approach to handily beat the S&P500 – that I quit using. This follow the sector (KTS #2) approach is a proven method that can be enhanced by digging in on the key stocks that move these sectors through cycle rotation. Also through KTS, we have clearly stated the phase of the current real estate/banking crisis cycle, the TIMING of its completion, and why the current portfolio looks like it does heavy in Capital Markets, Industrials, Materials, and mainly Commodity-related securities. Last year the portfolio looked different as the Tech sector was dominant. We have now reached the part of the cycle where Tech really begins to tire out. It is important to recognize that each Tech stock chart can behave very differently. For the TECH SECTOR, YOU NOW MUST GIVE ALMOST FULL WEIGHT INTO ANY ENTRY INTO ANY INVESTMENT DECISION BY LOOKING AT THE TREND IN EARNINGS ESTIMATE REVISIONS. At this stage in the meltup phase in TECH stocks, you should run from anything seeing a downtrend in earnings estimate revisions. Key points: This is not the case for other sectors/subsectors that are now coming into favor. This is not the case for other speculative securities that do well at this point in the cycle (e.g. AI related tech, Crypto (no earnings but highlighting to show speculatives that will continue to do well), Small/Micro caps, Biotech, and other FOMO speculatives). This is not the case for TECH companies that continually beat their rising earnings estimates. Why is this so? Naturally, higher interest rates are working against increasing company growth rates as the intent is to slow the economy and the TECH SECTOR (being the king of fast growth) starts to weaken. But we are now seeing the INSIDERS losing interest in parts of the Tech sector. For example, $XITK has fallen out of favor with Wall Street since the rise in commodity investments we read in the markets over a month ago. So many investors are heavily invested in Tech - and as pointed out before, even the Conventionalists and their S&P 500 investment vehicles are OVERLOADED with the performance of this sector. The new AI stocks are here. They are yesterday’s VALUE stocks that are currently transitioning to tomorrow’s GROWTH stocks. If you learn to read, listen, and TIME the markets and their cycles, you would know that this is where you should be buying now. $XOM , $NUE , $CCJ , $MTDR , $FCX and $EQT are just some of the new AI stocks for example. Tech is tired. Evidence please?: Zuck, Bezos, and Gates are selling huge positions. $META initiated a dividend $NFLX is quitting reporting their 2 most prominent valuation metrics: subscribers and ARPU Wall Street is not investing as heavily and is rotating out. Retrospective commentary - October 12th 2026 This retrospective commentary is the perfect opportunity to address something most investors are still missing, even though it’s unfolding right before their eyes. Big Tech is TIRING. Since this original post, $XLK has returned +101.67% versus +35.41% for $XLE . On the surface, that hardly looks like it’s the case. But you must go beyond a simple number on your screen. The Magnificent 7 now represent roughly 35% of the S&P 500. Few would dispute that this group has driven the bulk of the main indices’ returns in recent years. Let’s assess the S&P 500 situation. S&P 500 breadth (ticker: $S5TH, the percentage of constituents trading above their 200-day moving average) stands at just 47.7%. More than half the index is trading below its long-term trend. The S&P 500 is up approximately 14.17% year-to-date (as of October 12, 2026, before the open), yet roughly 65% of its constituents are underperforming the index itself. If you rank S&P 500 constituents by YTD performance, the first and best performing Mag 7 name doesn’t appear until #112. Within XLK, which holds 71 companies, you have to go down to #39 to find the first and best performing Mag 7 stock. And that stock is $AAPL, the only Mag 7 company that isn’t spending massively on the AI buildout. And that weakening can be seen in the YTD returns: $XLE : ~ +45% $SPY : ~ +14% $MAGS : ~ +12% The group that accounts for roughly a third of the index is TIRING – underperforming the S&P 500 – while Energy is accelerating and massively outperforming. Do we need to say it again?? $MAGS is lagging the market while ENERGY is OUTPERFORMING the market by more than 30%. Have you ever watched a relay race? You know how the speed of the runner passing the baton is slowly decreasing while the speed of the runner grabbing it is slowly increasing. The first runner’s rate of change in speed is declining while the second one’s is rapidly increasing as the baton gets passed. This is exactly what is happening right now: the baton just changed hands here in 2026, but most are still looking at the runner who is slowing down. If you’ve followed my work and read my publications, you know that a core element of the KTS approach is identifying where the puck is going and positioning ahead of the herd by stepping back and learning the future. This is the perfect illustration of this with yet another sports analogy.😄 Did you pay attention to the sentence I fully CAPITALIZED back in April 23, 2024? “For the TECH SECTOR, YOU NOW MUST GIVE ALMOST FULL WEIGHT INTO ANY ENTRY INTO ANY INVESTMENT DECISION BY LOOKING AT THE TREND IN EARNINGS ESTIMATE REVISIONS. You can look at the $ORCL 5-year chart if you want to assess if there is any valuable knowledge in that… Or $NFLX . 🤣👍 Still need more evidence that Big Tech is TIRING? There are key indicators that a sector is TIRING, other than its performance. Look at both charts attached. Notice the steady compression in free cash flow yields, which are projected to turn negative next year. Notice the second chart where we made an approximate average of all FCF forecasts and then overlaid the stock price of $META . Can you see the similarity? How can you use this data to evaluate where Meta’s stock price is headed? Have you read our “Google vs. the Government” post? If not, read it right away: https://www.blossomsocial.com/posts/Google-or-the-Government__POST-1787405080828-nDo2PppJ_qoQV3QbaHcPIAvML Now ask yourself this question again: When was the last time you saw a company spend at this scale and its stock outperform over the medium term? Just recently, I came across a Bloomberg article about $ORCL trucking in natural gas to power its AI buildout. With diesel prices at ALL-TIME HIGHS???? The spending simply cannot stop and they are now taking ridiculous actions, because they cannot afford to lose the AI race. It’s happening right before your eyes. As a shareholder, you must ask yourself how you will be rewarded by that frivolous spending. All of this while global energy majors offer double-digit FCF yields? 🤔 Now that’s a reward.🏆 Need more proof? Let’s come back to $XLK . Let’s look at its top-performing stocks this year: $SNDK , $DELL , $MU , $MRVL , $HPE , $LITE , $STX , $AMD , and $INTC . If you own any of these stocks, have you figured out what percentage of their revenue comes from the Mag 7? As Big Tech continues to TIRE (see charts below), would you consider the recent performance of these stocks particularly strong or sustainable if most of their revenue comes from Big Tech companies that are already TIRING and spending as if there’s no tomorrow? When the music stops, are these stocks going to drop FAST? Faster than you can react? If yields, inflation, and commodity prices continue to apply increasing pressure on the stock market, do you believe the music should stop sooner rather than later? So look beyond the simple green numbers on your screen. Compare $XLE’s ~44% YTD return to $XLK ’s ~36% YTD return. Ask yourself: which runner is handing off the baton……..to the other one taking off? 😉 If you want to know how Beskar Capital is positioning as we acknowledge this transition - and you want to know the course of action that Beskar Capital favors in this environment, our website is the best way to do so. I always give you my best! 🏆 This is the Way! 🏄🌊
144 views
0 Comments
No comments available.
Join the conversation with 500,000+ other investors 💸
Create an account to get access to everything Blossom has to offer!
📊 Personalized algorithm based on your investing style, experience level and interests
📈 Powerful portfolio and dividend tracking tools
👀 See what top creators and others in the community are investing in