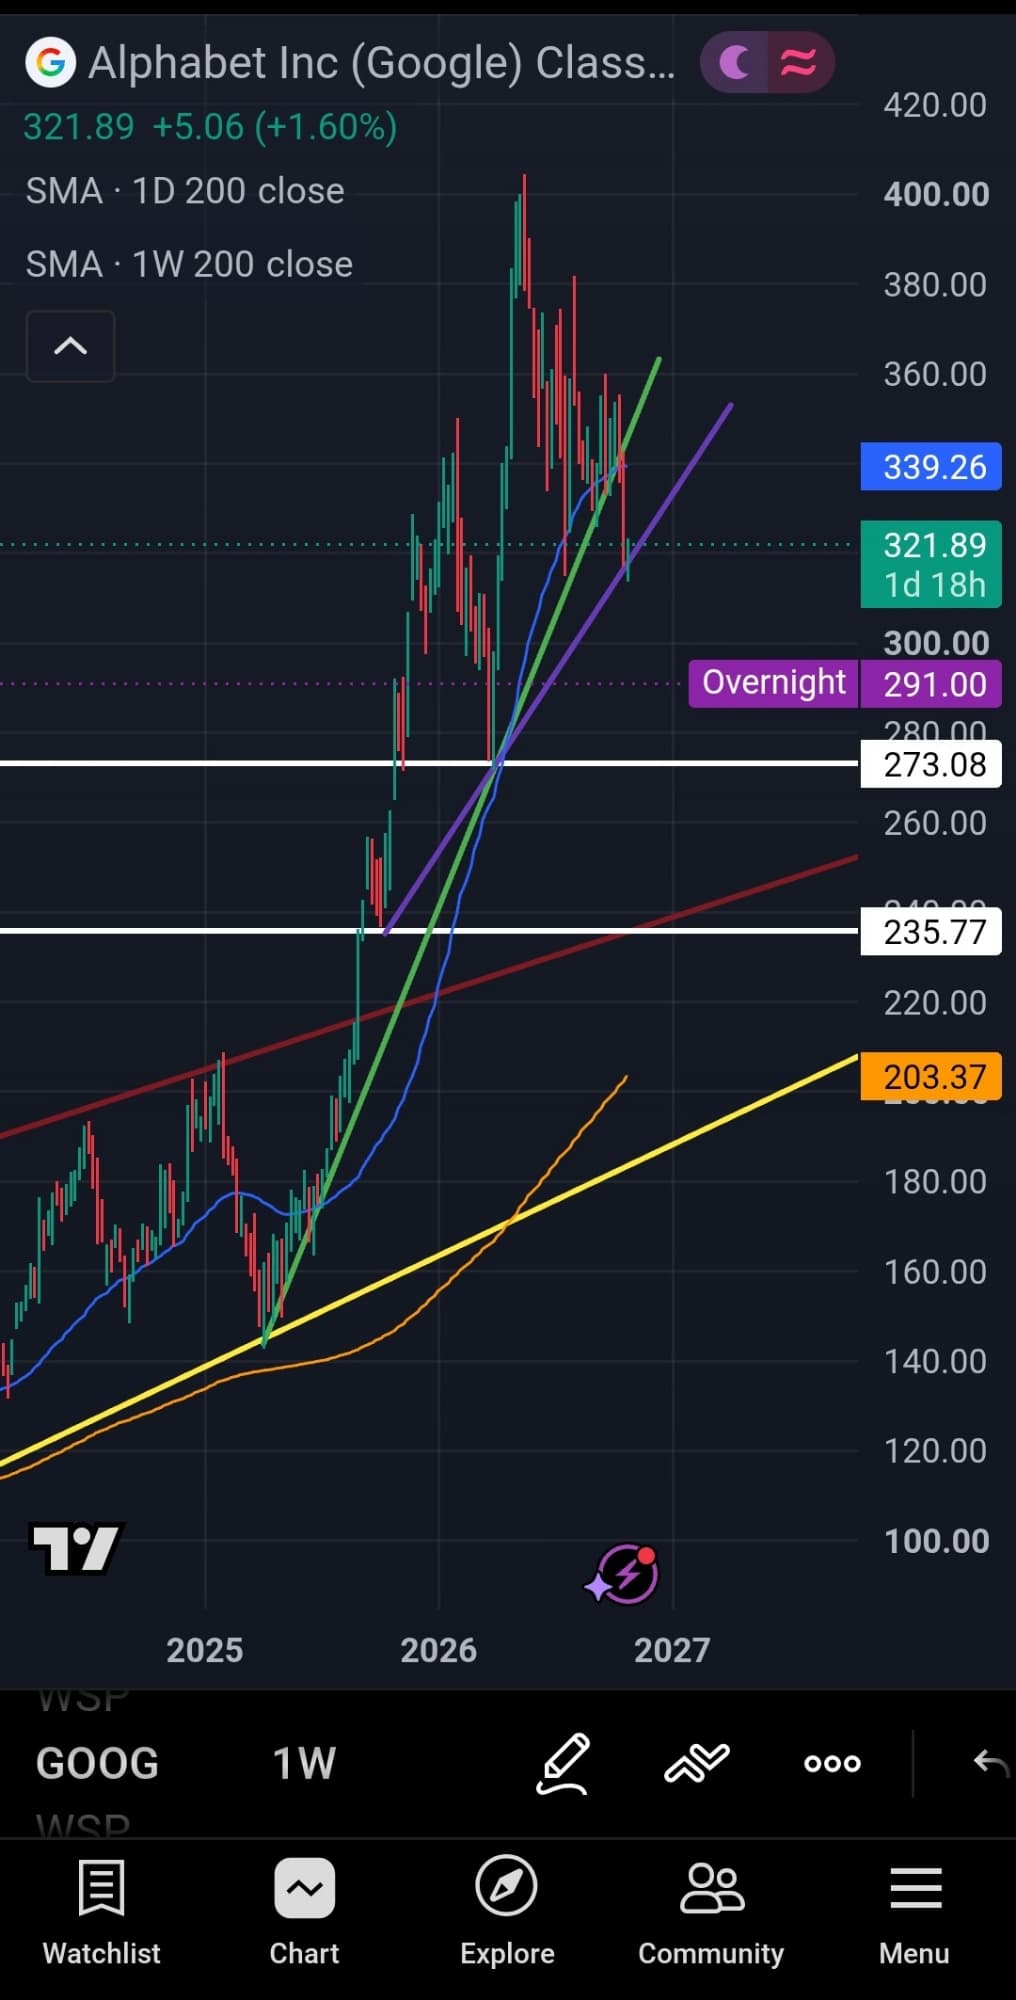
Hello $GOOGL / $GOOG shareholders. Not a great showing on earnings today but I wanted to cast a lense through some quick charting technicals to decide "what now" I'm still but a student of technical analysis but consistently trying to use it as part of my fundamental investing strategies to time my buys a bit better. To summarize: The green and Purple line represent two different low pivot trendlines. Over the last two weeks both of these have been broken. The next support we would be looking at is the white line on 273.08. This acts as a horizontal pivot and where I would consider adding to Google. If that breaks, we run into the second Major support on the white line at 235.77. The red line nearby is a pivitol line; this was the pivot marking the 2022 high that acted as a major resistance until it broke out in Sept 2025. Maintaining above the red line is imperative to ensure the long term trend remains bullish. Obviously not financial advice as I am a student of technical analysis, but I thought this would be useful for some of you wondering if you should add on this 9% drop. tl;dr consider aiming a price target around 273 to try to bottom time the drop.
30 views
1 Comments
Oladisun
@stilldisun90 · 1h
Tapped out early. Watching the 262 - 272 drop zone
See the full comment section 👀Sign up for the full Blossom experience!