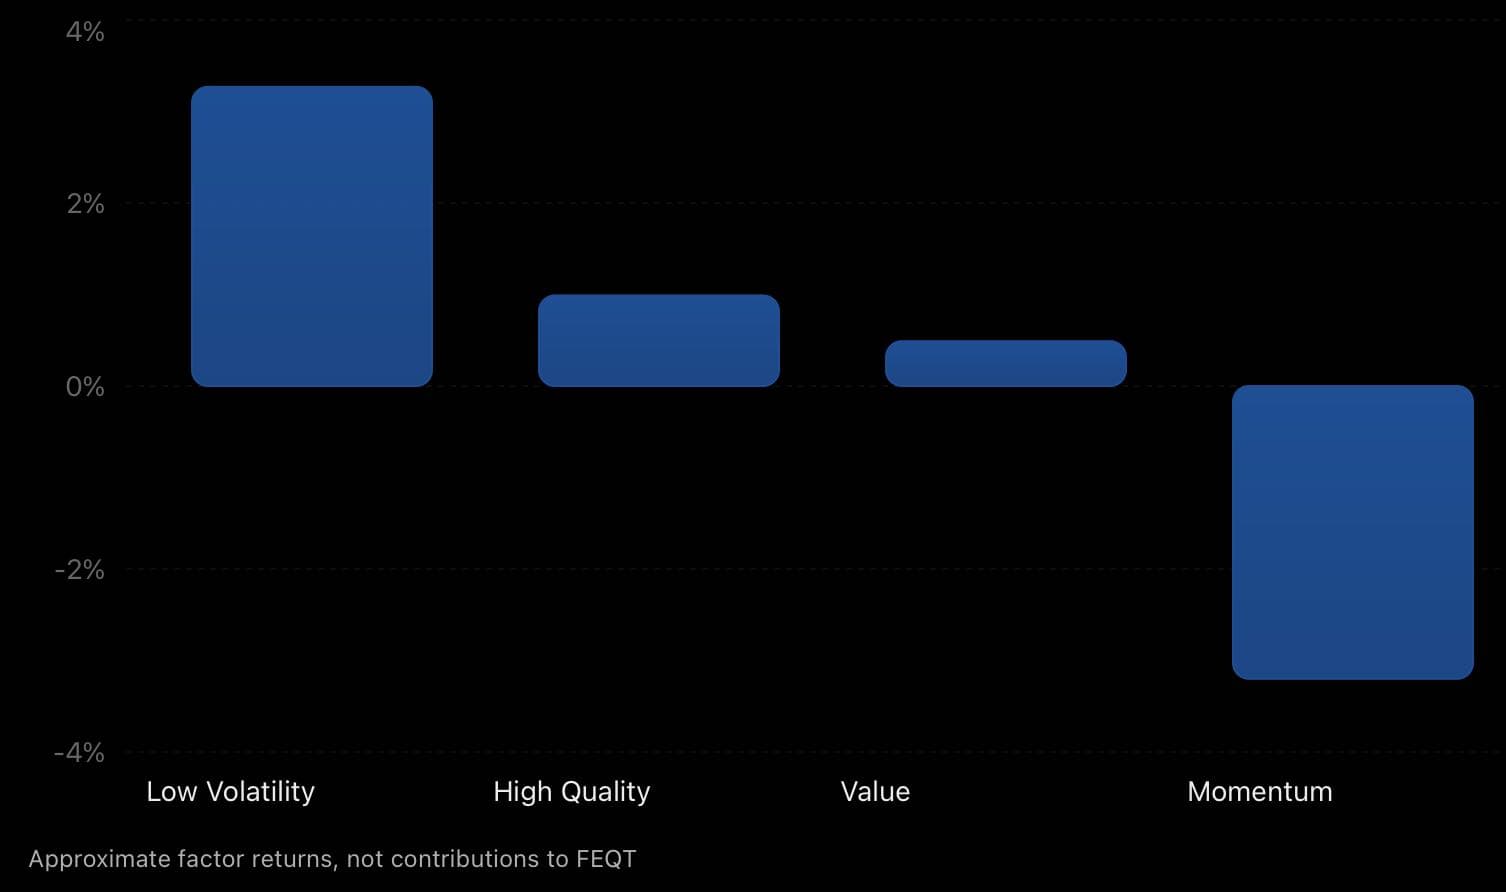
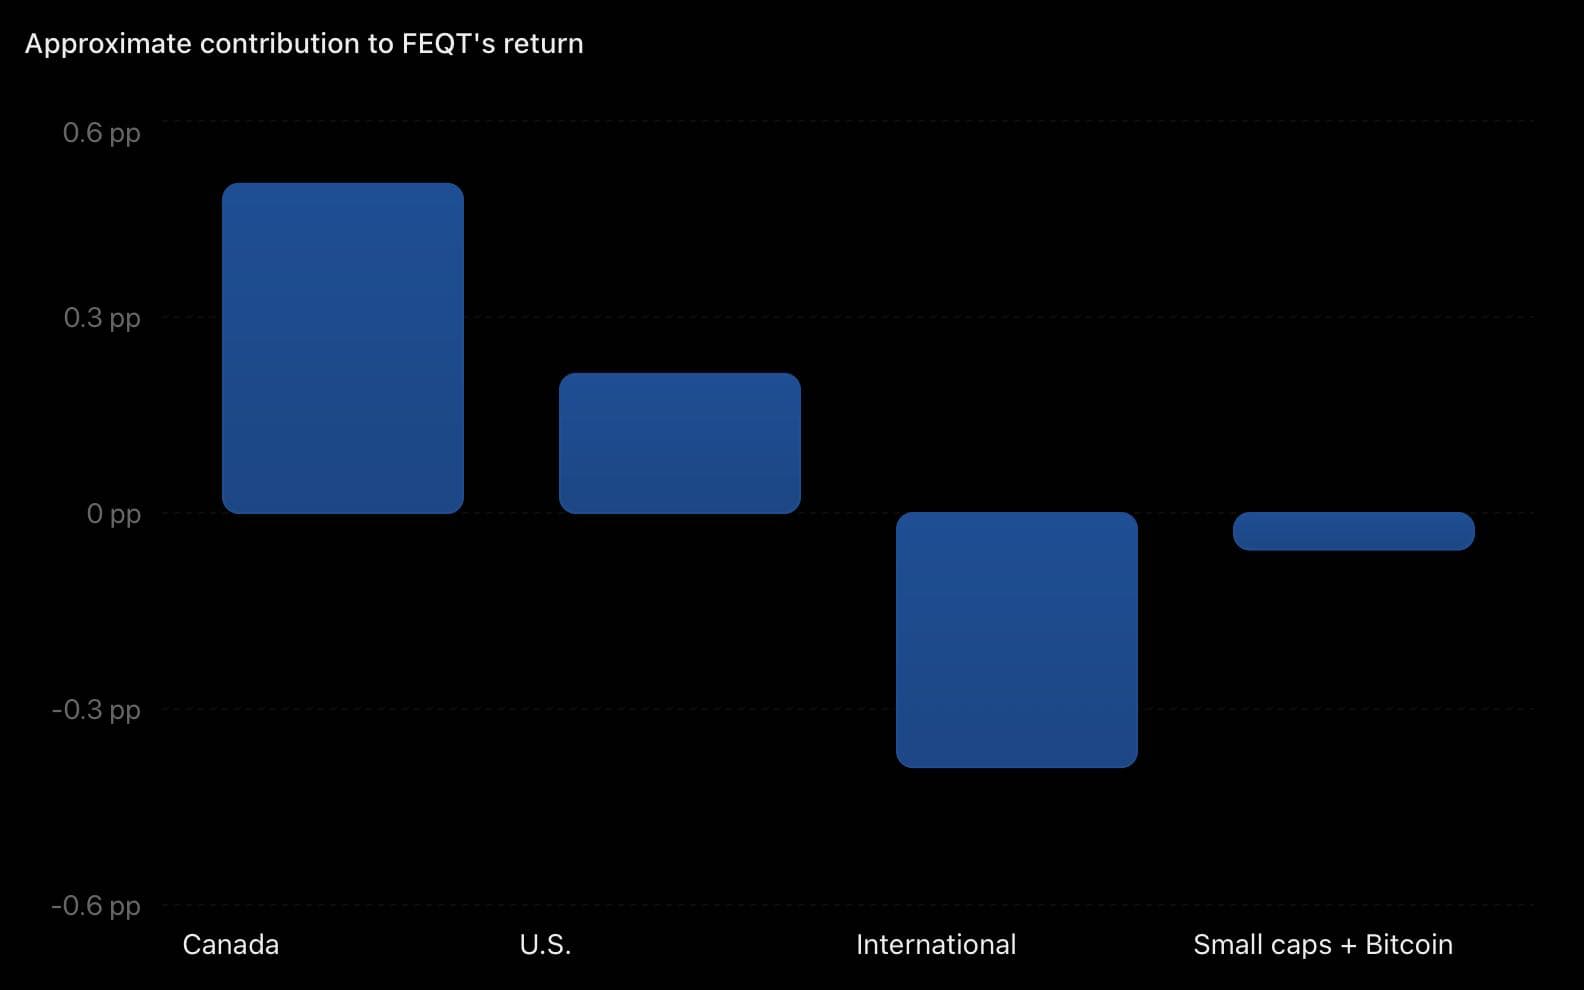
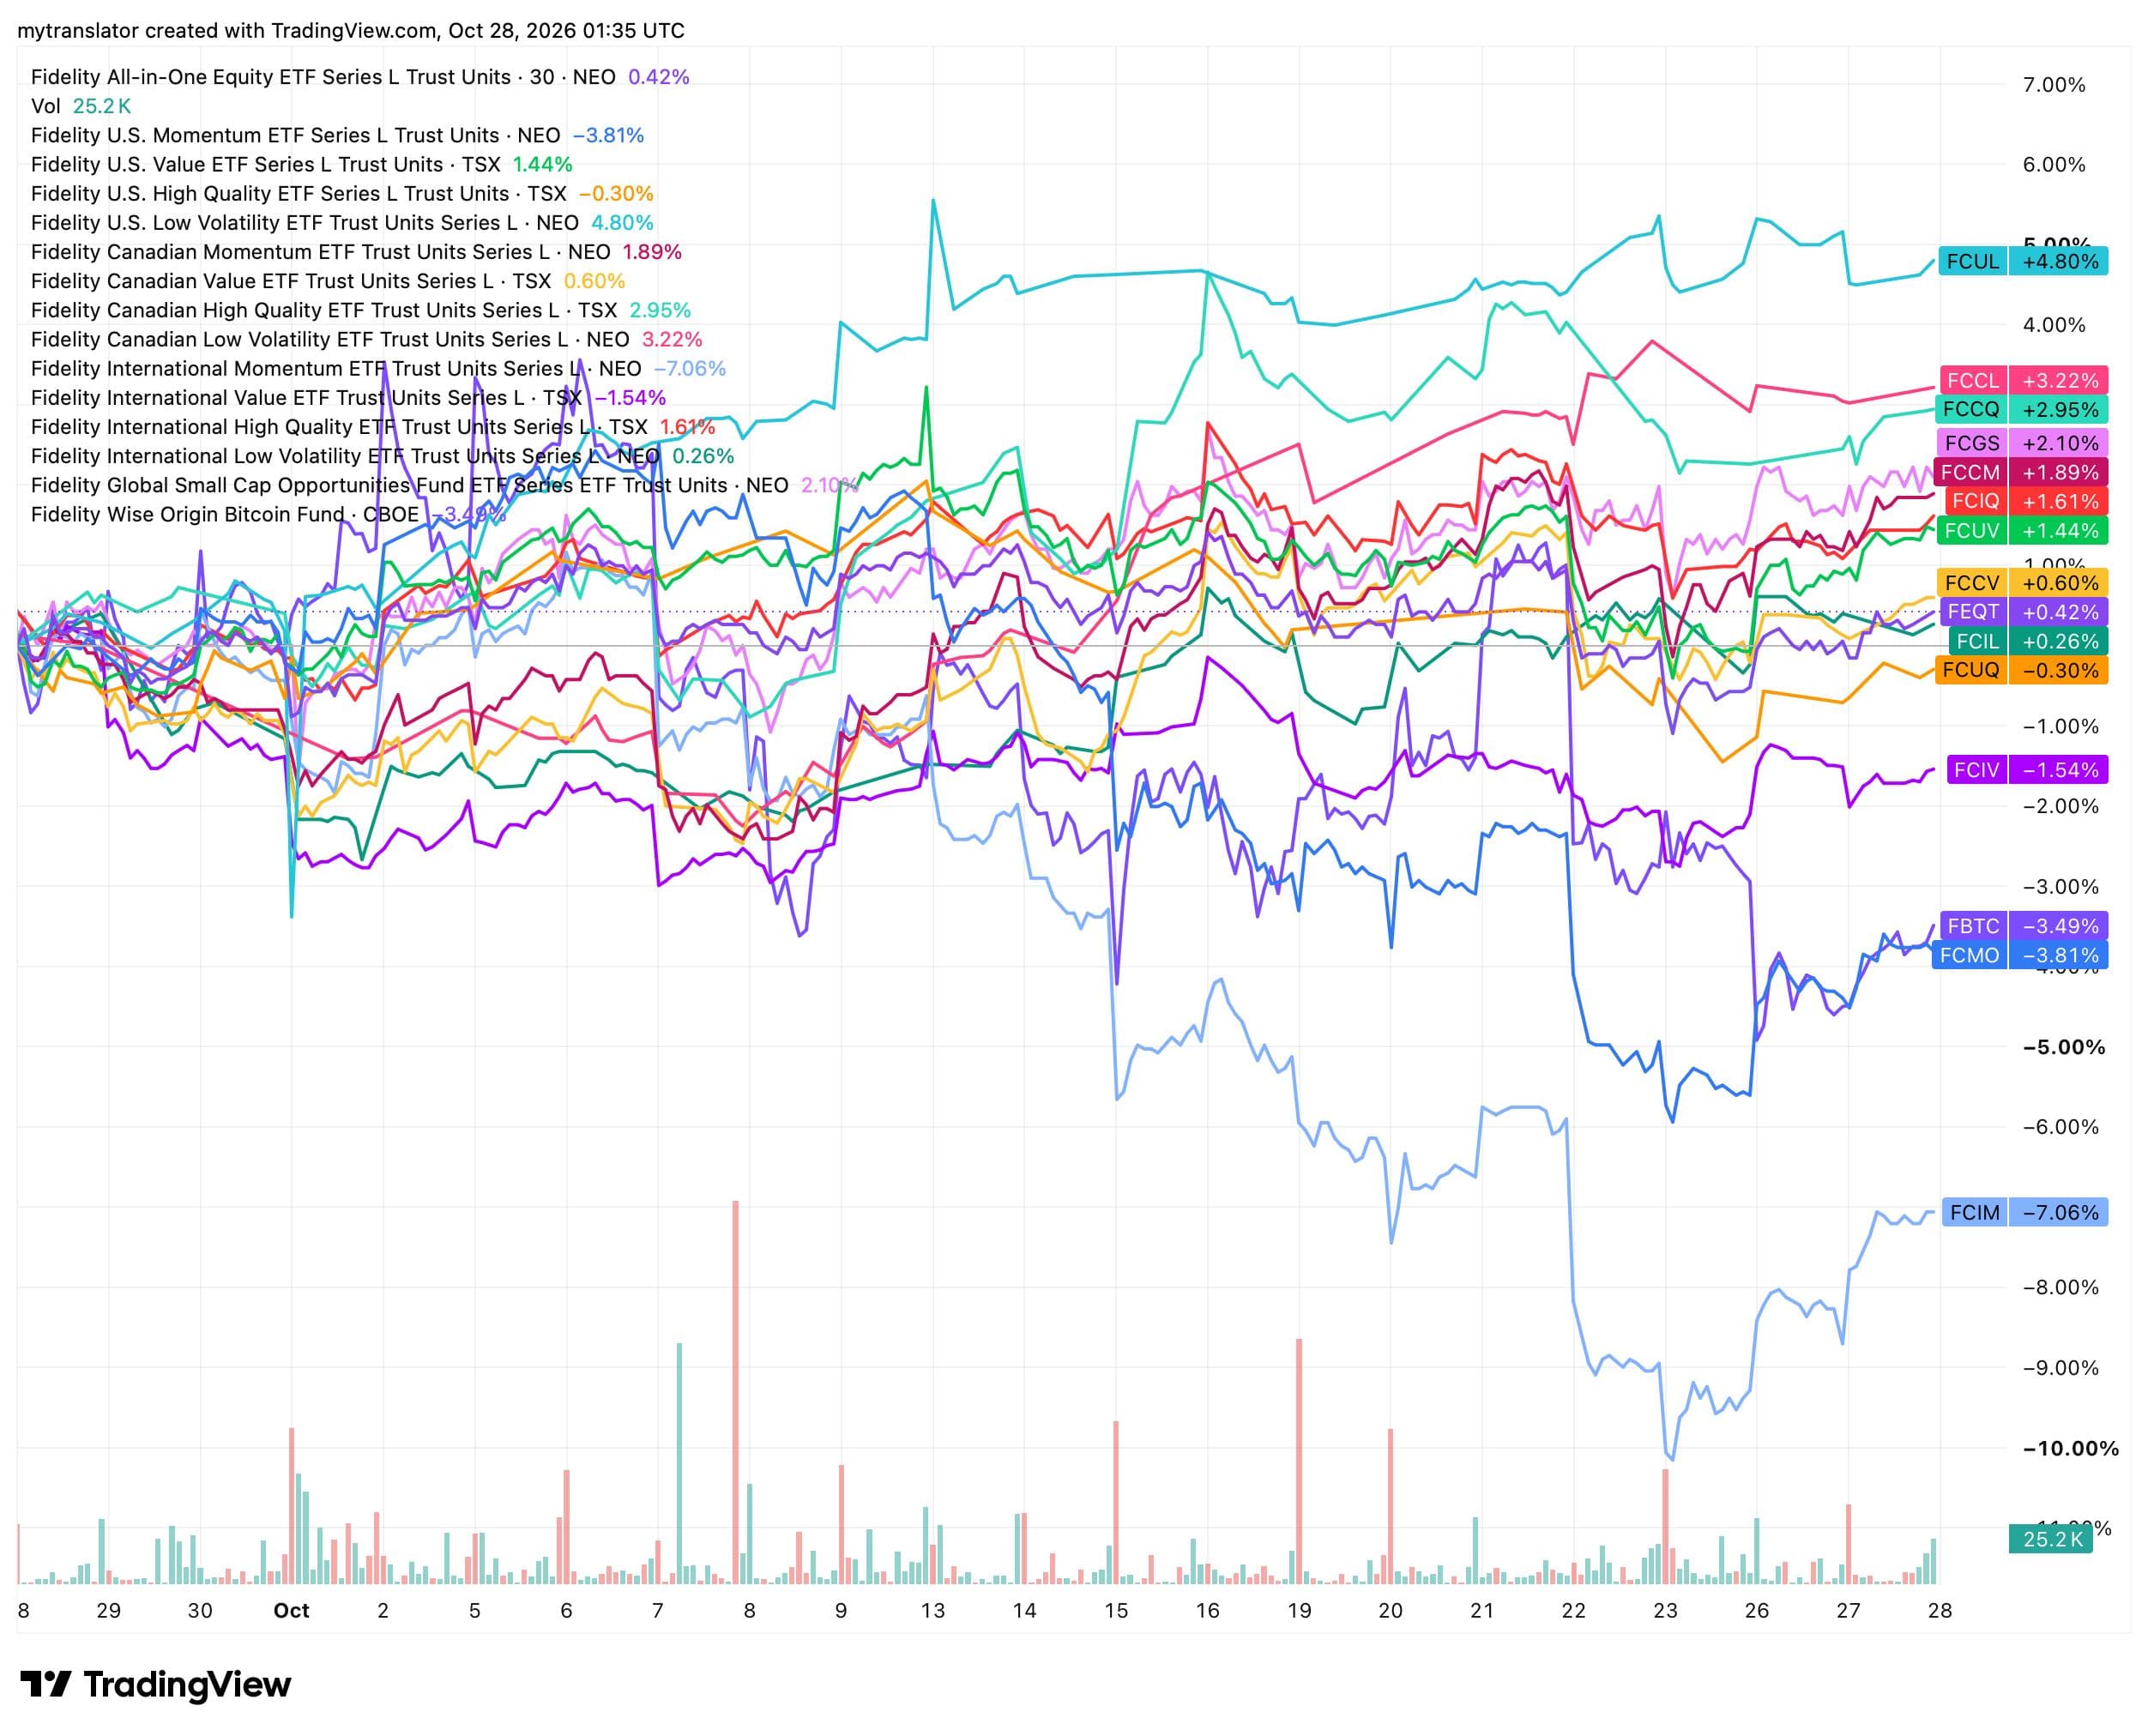
+0.42% over the past month for the $FEQT all-in-one. That's pretty uneventful, right? Think again! I plotted the performance of FEQT's 14 underlying ETFs over the past month using TradingView, and what happens beneath the surface is fascinating! Just look at these numbers: 🟢 U.S. Low Volatility (FCUL): +4.80% 🟢 Canadian Low Volatility (FCCL): +3.22% 🔴 U.S. Momentum (FCMO): −3.81% 🔴 International Momentum (FCIM): −7.06% That's almost a 12-percentage-point difference between the best and worst performers. Inside the SAME ETF! Even more interesting, all four Canadian factor ETFs finished positive, while international Momentum took a serious beating. And yet, FEQT itself managed to remain positive. This is factor diversification in action! When Momentum struggles, Low Volatility, Value or High Quality can help cushion the impact. Different factors behave differently across markets, and that's precisely the appeal of combining them. Rather than trying to predict which factor will outperform next month, FEQT gives me exposure to all four, across multiple regions. Of course, one month doesn't prove anything about long-term outperformance. But it beautifully illustrates why I appreciate FEQT's construction. FEQT's +0.42% looks boring on the surface. Under the hood, though, there's an entire investment ecosystem at work! 😅 The lesson? A simple portfolio such as mine, with just 1 core holding, doesn't necessarily mean there's nothing sophisticated happening underneath. 🚀
894 views
3 Comments
Regis
@mytranslator · 7d
To complement my analysis above, two very interesting graphs!
george Young
@geo_van · 7d
I’m a huge fan of $FEQT - actually hoping that the Bitcoin portion of it pays off long term.
Enid Vadeanu
@enidv · 6d
Interesting
See the full comment section 👀Sign up for the full Blossom experience!