Forget the Noise & Join Me In Tracking Money Flows
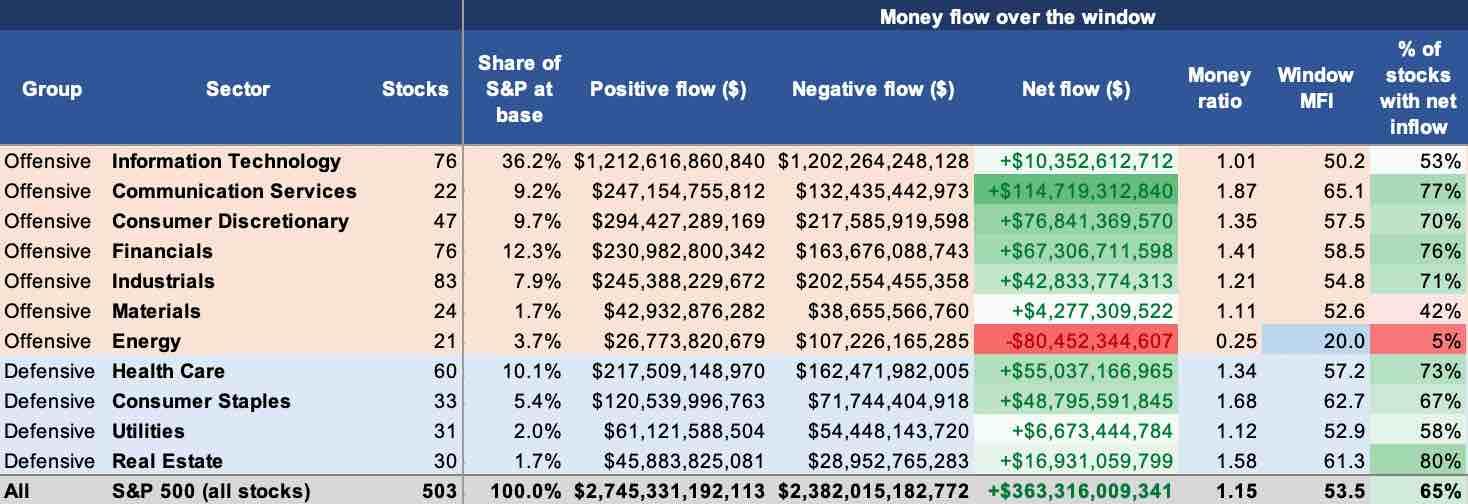
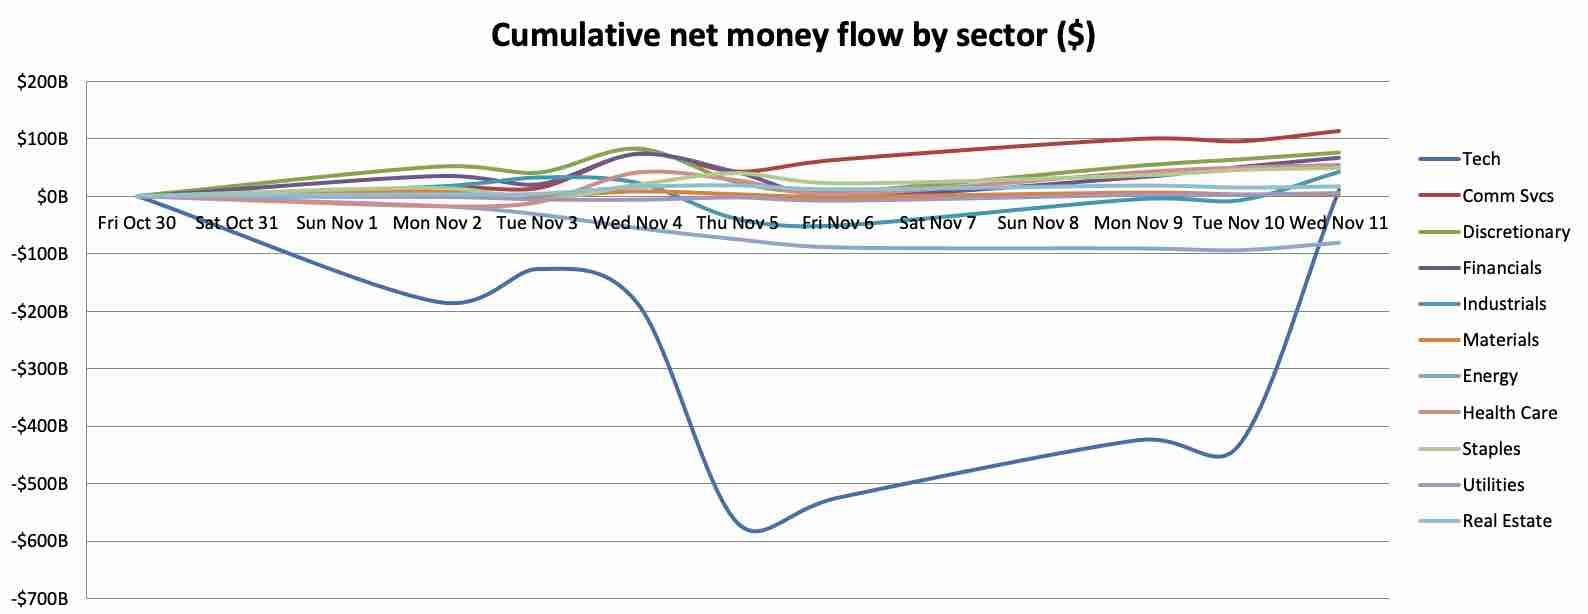
I know you guys appreciate the in-depth research posts more than anything else I write and tonight I have a JUICY 2 post series for you that will blow your socks off. We will be going on a journey of reflection to sniff out how institutional investors have been behaving with their money since Nov. 2nd until today. All jokes, memes, market news & affairs aside... tonight we're back to serious insights about the lovely market. I've tracked every stock in the S&P 500 and split them up by sector to monitor how the money's been flowing for 8 trading days in November so far across every single stock and sector in the S&P. Let's get started by unpacking how net flows moved over the 8 day period and watch how NET money flows went in & out of the S&P 500. Nov. 2nd: -$73B Nov. 3rd: +$6.2B Nov. 4th: +$162B Nov. 5th: -$580B Nov. 6th: -$75B Nov. 9th: +$335B Nov. 10th: +$21B Nov. 11th: +$566B Nov. 12th: ??? (if the pattern continues it will be a Negative flow day) We've been mere puppets this whole month with the wolves taking us on a rollercoaster ride for 8 days of ups & downs... enough swings to make anyone throw up. On the worst day Nov. 5th only 15% of stocks closed positive and on the best day which was Nov. 9th 84% of all S&P stocks closed positive. But, are all sectors reacting the same on the good and bad days? or are there visible rotations? To answer that I will direct you to the first table in the images below. Watch the sectors Money flows. The heavy concentration of money moving out has been directed towards: $XLE Net Flows = -$80B $XLK Net Flows = +$10B (barely made it across in W2) $XLB Net Flows = +$4.2B To show you how rough the Technology sector’s ride was please observe image 2 below showing the cumulative money flow of the period... the sector was left for dead last week and made a COMPLETE recovery to close flat earlier today. That sector had $2.41 Trillion trading across its 76 stocks and netted out +$10B after all that… that’s peak volatility for you, not a smooth sailing anymore for AI. The 3 best performing sectors where money flowed in aggressively: $XLC Net Flows = +$114B $XLY Net Flows = +$76B $XLF Net Flows = +$67.3B All other sectors were mixed performance through the period with $XLV & $XLP showing the most promising trend. Now as you might know Technology as a much higher direct impact on the S&P as it represents almost 40% of the index while Energy with it’s -$80B outflows barely makes a dent as it only represents 3% of the index... Just for perspective. Ok now for the GRAND FINALE... Do you guys want to know the top 20 stocks where money flows ran for the door and top 20 companies that attracted money flows as a safe haven ? Well, I will give you just that and it will be an EPIC list of 40 companies showing you all exactly the winners and losers during the days when the market crashed and when it peaked. But, You’ll have to stay tuned for my next post to see them… I promise you won't wait for too long just have patience for 1 hour and you’ll see the second post…. in the mean time if you enjoyed this work and look forward to the lists show this post some love so more people can see it and benefit.
Thank you Moe!! So happy that you tagged me 👍👍👍👍 Thank goodness I understand most of this but the charts always captivate me!!!! Patiently waiting for part 2…. 🏆🏆🏆🏆🏆🏆🏆🏆
CoderDonna @coderdonna · 8h
Mmmm, I do love me some data! So this is the analysis, next are the implications. Why are wolves manipulating the market in this manner? Is it deliberate, with an end goal in mind? A reaction to all the news and events happening now? Maybe it's just that guy in the leather jacket? lol Looking forward to your thoughts! 🧐
See the full comment section 👀Sign up for the full Blossom experience!