HHIS After 17 Months: My Results
I’ve held this fund for 17 months now, so how has it been holding up?
I’m going to share my numbers, but remember these are my personal returns, not the return of the fund itself. I started buying HHIS on April, 2025, and I have continued adding shares over time. I did not invest all of the money in one lump sum, so a standard CAGR does not really tell the full story of my experience.
That is why I am going to include XIRR. Since I bought shares at different times and received distributions along the way, XIRR gives me an annualized money-weighted return that takes the timing of those cash flows into account.
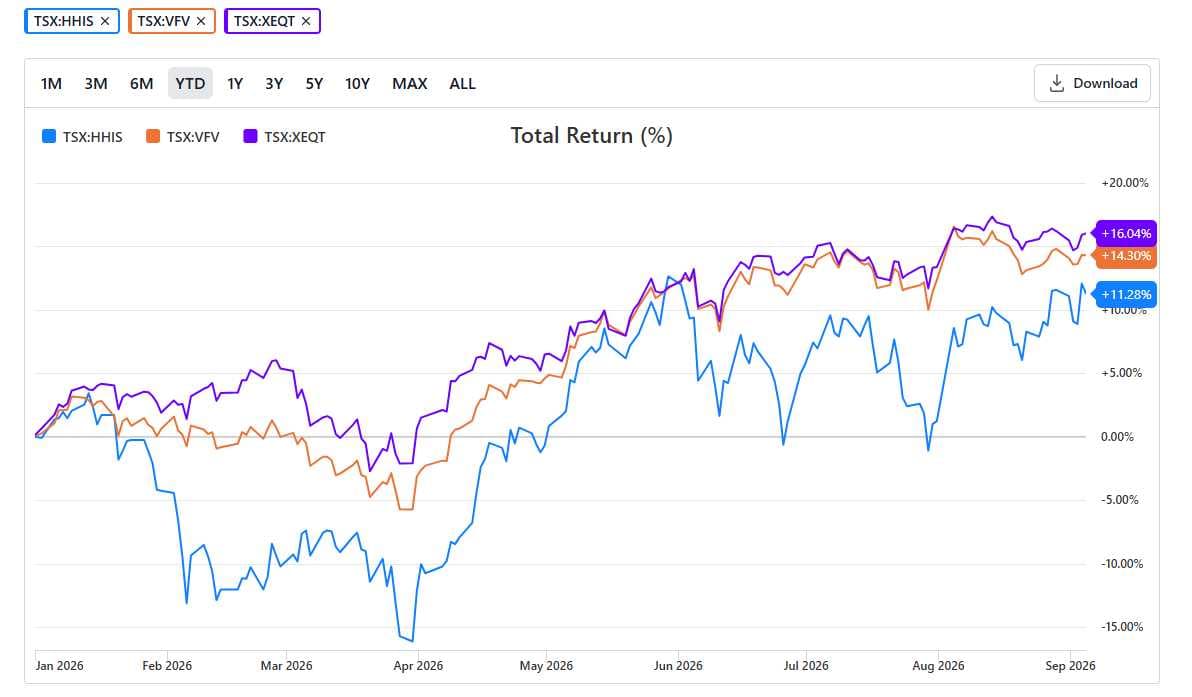
If we look at HHIS itself year to date, Stock Analysis currently shows a total return of around 11.28%. If you compare that with something like VFV or XEQT, HHIS has underperformed. But that is the return of the fund. That is not necessarily the same thing as my return, because I bought my shares at different prices and at different times.
So let’s jump into my numbers.
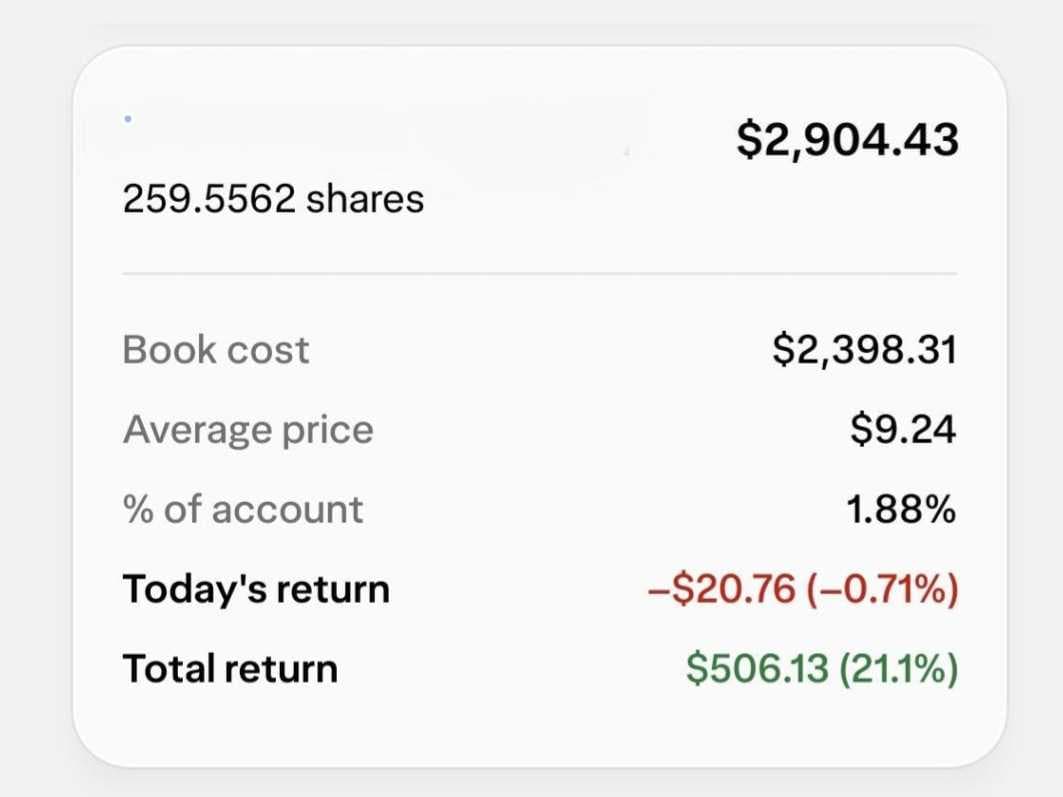
I have purchased a total of 259.5562 shares for a total cost of $2,651.14. That is the actual capital I put into this investment, which gives me an average purchase price of about $10.21 per share.
Now if I look at my brokerage account, it shows a book cost of $2,398.31, or about $9.24 per share.
Why don’t those numbers match? Because this is a taxable margin account and the broker has adjusted my cost base for the return of capital I received in 2025. Return of capital reduces the adjusted cost base of the investment.
This is one of the reasons I like tracking my own purchases separately. I can still see exactly how much money I actually put into the investment instead of only looking at the tax-adjusted book cost.
Using my actual purchase cost of $2,651.14, the current value of $2,904.43 represents a price return of about 9.55%.
If I used the broker-adjusted cost base of $2,398.31, the price return would look much higher at about 21.1%.
The adjusted cost base is mainly a tax number that matters when I eventually sell the fund and calculate my capital gain or loss. It is not the number I want to use when measuring how the investment has actually performed for me.
To measure how the investment has actually performed, I want to look at total return, and to do that I need to include the distributions I have received along the way. Since April 2025, I have received a total of $900.33 in distributions.
So my results, using my actual book cost rather than the tax-adjusted cost basis, look like this:
Price return based on what I actually paid: 9.55%
Total return including distributions: 43.51%
XIRR: 48.70% annualized
That is a pretty big difference between looking at the share price alone and looking at the actual economic return I have received from the investment. And that is exactly why I think you need to look at more than just the chart when evaluating an income investment.
Now knowing what I know today, I would have liked to have put a lot more money into this investment because it has worked out quite well for me. But I didn’t know that going in. It could have performed better or it could have performed worse. No one has a crystal ball when they make an investment.
For me, HHIS has worked out well on a relatively small amount of money. For someone else who bought at different prices or at different times, their experience could look very different. And these numbers only show my personal results.
They don’t tell you what is happening inside the fund itself. They don’t tell you how well the portfolio is being managed, how much income the underlying holdings and strategy are actually generating, or whether the distribution is fully supported or the fund is paying out more than it is economically earning.
Going forward, no one knows what HHIS will look like. The return could be better, it could be worse, and the distribution could stay where it is or eventually be reduced. That uncertainty is part of investing. You make the best decision you can with the information you have at the time, and then you see how it plays out.