High Yield Covered Call ETFs is your money back
THE "35% COVERED CALL YIELD" THAT ISN'T A YIELD:
WHY SPENDING 1/3 AND REINVESTING 2/3 CAN STILL RUN DRY
For retirees and people about to retire I hope you don’t get suckered into unecessary risk.
Let’s use Blossom’s popular HHIS as the example, but the math applies to any cc fund built the same way: momentum stocks, plus leverage, plus covered calls minus fees.
PART 1: THE 35% IS A DISTRIBUTION, NOT A YIELD
- Harvest's website shows a "current yield" of 34.88%. Their brochure defines it as the latest monthly payout times 12, divided by market price: $0.27 x 12 = $3.24, divided by $9.29.
- That measures what the fund pays out, not what it earns.
- A real dividend comes from company profits. A distribution is whatever cash the fund sends you: profits, option premiums, sales of holdings, or your own money handed back.
- The price fell from $12.00 at launch to $9.29. The payout stayed $0.27, so the "yield" rose from 27% to 35%. A rising yield on a falling price is a warning sign, not a raise.
PART 2: WHAT THE 35% IS MADE OF (FUND REPORTS)
- 2025 (first year): $2.80 paid per unit. Return of capital was $1.76 (63%), capital gains $0.99 (35%), other income $0.05 (2%), eligible dividends zero.
- First half of 2026: $1.62 paid. Return of capital was $0.80 (49%) and capital gains $0.82 (51%).
- Option income is mostly labelled capital gains, so that slice is covered calls plus profits from selling holdings.
- Harvest's own documents say: "If a Fund earns less than the amounts distributed, the difference is a return of capital."
- First half of 2026: the fund earned $0.82 a unit and paid $1.62. The $0.80 shortfall matches the return of capital, and the price fell to cover it.
- 2025 looked better: it earned $2.92 and paid $2.80. But only about $1.10 was realized. The other $1.70 or so was paper gains from a hot market.
- Real stock dividends were tiny, about $0.04 to $0.06 a unit per period.
PART 3: WHAT THE FUND CAN EARN PER $100 (ESTIMATES)
- Dividends: about $1. Growth names pay almost nothing.
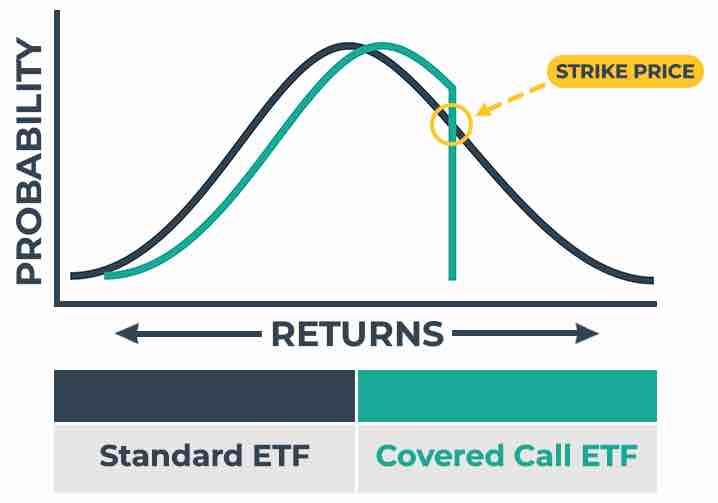
- Option premiums: about $7 to $12. This assumes calls on about a third of holdings at 1.5% to 2.5% a month. You give away the big gains on that slice.
- Price growth after the calls: $0 to $3 in a typical year, and negative in a bad one.
- Fees and interest: about $2.
- Net: about $6 to $12, call it $9.
***The fund pays $35, so about $26 a year is your OWN money coming back. The engine covers one fifth to one third of the payout.***
- Options don't create new money. They turn future gains into cash today and give up the best gains to do it.
PART 4: WHERE THE FEES HIDE
- The website says "Management fee 0.00%," then notes in small print that the fund is "subject to fees of the underlying ETFs."
- HHIS owns about 20 Harvest single-stock ETFs. Each charges its own fees and each is leveraged about 25%.
- ETF Facts show a MER of 1.85% plus 0.15% trading costs, about 2.0% all-in. The MER includes HHIS's share of the underlying ETFs' expenses.
- The ETF Facts say the MER "would have been higher" without waivers. Sister fund HHIH shows 0.99% after waivers and 1.35% before, so HHIS's true cost could be about 2.4%.
- Proxy for the 1.85%:
- Management fee plus tax: about 0.45%.
- Interest on the 25% borrowing: about 1.0% to 1.25% (I assumed a 4% to 5% rate).
- Admin and other: 0.15% to 0.4%.
- By my estimate, interest is more than half.
- On $500,000, 2% is $10,000 a year. A plain index fund costs $500 to $1,000.
- If the fund earns about 11% before costs, fees and interest take about one fifth of it.
***Not in the MER: upside given away to the calls, and extra losses from leverage in falling markets.***
PART 5: HOW THE MONEY RUNS OUT
- Buy $100,000. Spending 1/3 of the 35% payout is about $11,600 a year, or 11.6% of your starting money. The old safe rule is about 4%.
- Reinvesting the other 2/3 doesn't help much. Those units fall with the rest.
- Raise spending 2.5% a year for inflation, assume a constant annual return, and $100,000 RUNS OUT:
- 6%: about 10 years
- 8%: about 12 years
- 10%: about 14 years
- 12%: about 19 years
- 13%: about 24 years
- 14%: indefinitely
- With no inflation raises, 8% returns lasts about 15 years and 10% about 21.
- Retire at 65 on 8% to 10%, and the money is gone between 77 and 70.
- If the payout floats and is cut when the price falls, the account won't hit zero but your income shrinks. Either way the retiree loses.
PART 6: WHY 14% FOR 35 YEARS IS UNREALISTIC
- The plan needs about 14% a year, after fees, to last the entire 35 years.
- The US market has averaged about 10% over the very long run. The fund would need to beat it by about 4 points a year, after 2% in costs.
- To my knowledge, no broad US ETF 35-year stretch has come close to 14%. The best were roughly 11% to 13%.
- The fund holds the same kinds of stocks as the market, with calls capping the upside.
Nothing in the design points to a 4-point edge.
- Roughly 9 in 10 professional managers trail their benchmark over 15 years or more, and this fund starts 2% behind.
- HHIS earned about 20% a year until April 30, 2026, the best of times for its stocks. Since then the annualized return since launch has fallen to about 11.7%, and it is still dropping.
- Trouble can show up fast inside the basket. The Harvest SoFi ETF launched at $12.00 in September 2025. Its NAV was $5.38 by June 30, 2026, after $2.28 in payouts.
PART 7: THE ODDS (ROUGH ESTIMATE)
- Assume a 10% average return with about 25% yearly swings. HHIS had monthly moves from -9% to +11% in 2025.
- Swings drag down compounding. Gain 50%, lose 50%, and you have 75 cents on the dollar. The long-run compounded return is about 7%, and the plan needs 14%.
- Over 35 years, that gap is roughly 1.5 standard deviations. The odds are about 1 in 14. At a 12% average they are about 1 in 6, and at 8% about 1 in 40.
- Of 100 retirees following the plan, roughly 3 to 16 would still have money at year 35. This ignores sequence risk, which makes the above worse.
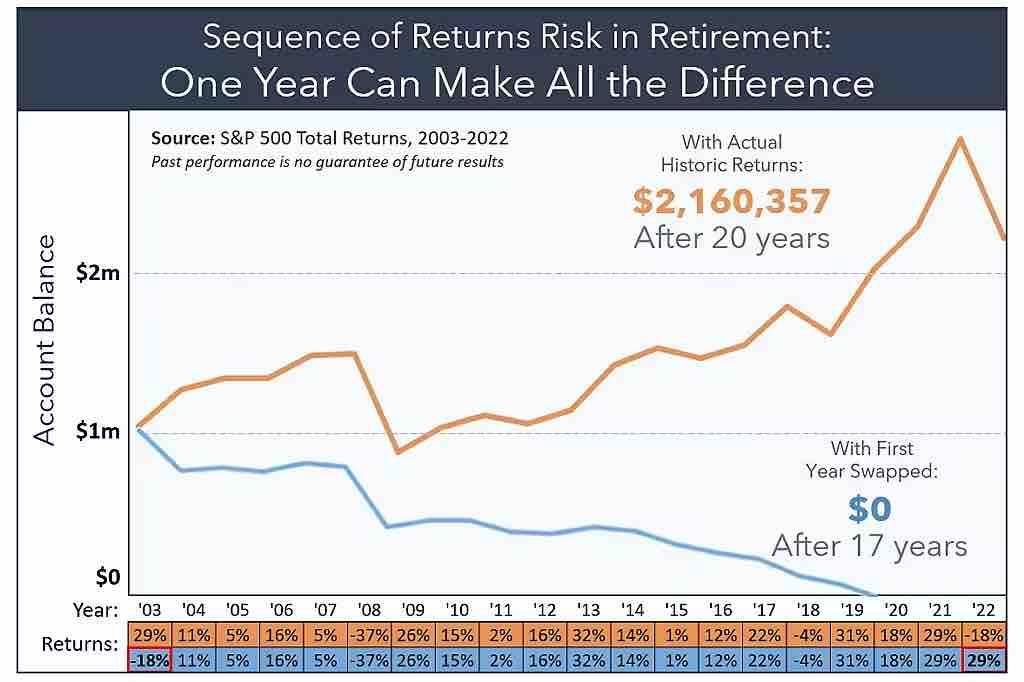
PART 8: SEQUENCE RISK
- Two retirees start with $100,000 and spend $11,600 a year. Both get returns of 30%, +10% and +30%, in a different order.
- A gets the crash first and has about $56,800 after 3 years. B gets the crash last and has about $71,400.
- That is the same returns and the same spending, with a $14,600 difference. You can't buy cheap units with money you already spent.
- A real case: $100,000 in at about $12.23 on Jan 1, 2026, with 1/3 spent and 2/3 reinvested, is worth roughly $88,000 today, plus about $7,400 spent. That is down about 5% in a year that felt like 35%, with the unit price down about 25%.
PART 9: THE ENTITLEMENT TRAP
- Many retirees using CC funds now receive more than they earned in their best working year. That feels like proof it works.
- A paycheque came from an employer who owed it to you. A distribution is your own money returned, plus whatever the fund earned. The fund owes you nothing and can cut the payout at any time.
- The only number that matters is total account value, this year versus last year, after spending.
PART 10: WHAT TO EXAMINE OBJECTIVELY
- Judge any income fund by total return after fees (price change plus payouts, minus costs), not by false claims of “yield”.
- Set realistic spending from your whole portfolio at about 4% to 5%.
- Limit the risk to a fund like this to 5% to 10% of the portfolio.
- Hold two to three years of spending in cash or short-term bonds, so you never sell a falling fund to pay bills.
- Each year, ask whether your account is worth more or less than a year ago, after spending.
- Talk to a fee-only planner who isn't paid by the product.
BOTTOM LINE
A 35% distribution isn't a 35% return. It is a spending rate wrapped in a monthly cheque. The goal isn't a big cheque this year. It's a cheque that still arrives when you are 90.
General education, not personal investment advice. Figures are as of Nov 20, 2026 and change monthly. Estimates are labelled.