How To Use the MACD in Your Trading
MACD (Pronounced Mac-Dee) is the short abbreviation for the moving average convergence/divergence technical indicator. The MACD is a trading indicator used in technical analysis to filter and trade price action momentum on a chart. It was created by the late Gerald Appel in the late 1970s as a tool for technical analysts. It was created to visually show changes in price strength, direction, momentum, and duration of price trends and swings on a chart.
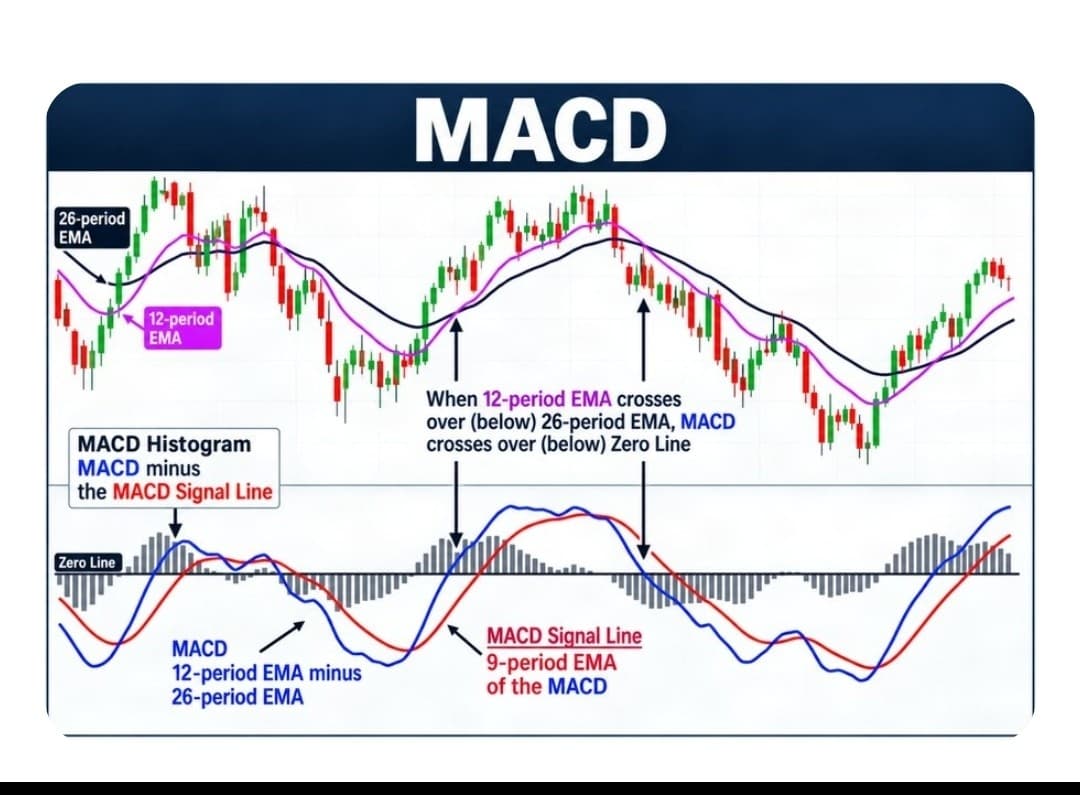
The MACD is a simple visual momentum indicator. The MACD uses two moving averages as trend-following indicators and creates a momentum oscillator by subtracting the shorter-term average from the longer-term average. This formula creates the MACD as a dual indicator for both trend identification and momentum magnitude. The MACD lines fluctuate above and below the zero line in the histogram as the moving averages converge, cross, and diverge.
How to use MACD:
Traders can wait for signal line crossovers, center line crosses, and divergences as potential trading signals. The MACD is not bounded by set parameters, so it’s not a good tool for identifying extended overbought or oversold price levels. It is a trend and momentum indicator and shows the current direction of a move.
The MACD is calculated by subtracting the 26-period Exponential Moving Average from the 12-period EMA. The answer to the calculation is the MACD line. A nine-day EMA of the MACD is called the signal line. This is the faster signal line that moves with the MACD line and can act as a crossover trigger for buy and sell signals in the direction of the price move, helping capture trends or swings.
Many traders may use it as a buy signal when the stock's MACD line crosses above its signal line, and then lock in profits when the signal line crosses back below the MACD line. The MACD indicator can be used in many ways, but it is commonly used to generate signals from crossovers and divergences.
The bullish MACD crossover signal can indicate momentum and a possible swing higher in price that could evolve into a sustained trend. A bullish crossover can occur near a price bottom after a rally from the lows, or when the price breaks out of a price range. A bearish MACD signal-line cross can indicate an early loss of momentum when a trend turns into a range and fails to make new highs. A bearish MACD cross under can also signal the beginning of a downtrend and the end of an uptrend.
The MACD works best when used with other technical indicators for confirmation. For example, if you use MACD crosses to get into a trade, you could use the Relative Strength Index (RSI) to exit and lock in gains as a chart becomes overbought with a 70 RSI zone or oversold with a 30 RSI zone. Also, if you have a key moving average crossover signal on a chart, a bullish MACD crossover can confirm the trade, adding confluence and increasing the trade's odds of success.
The MACD can help with trading price action on a chart by showing the current directional bias along with key turning points.