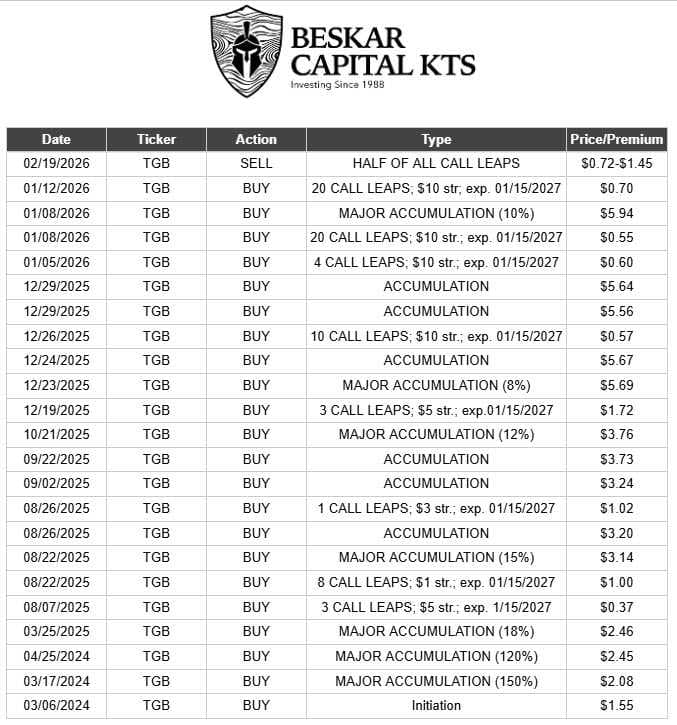
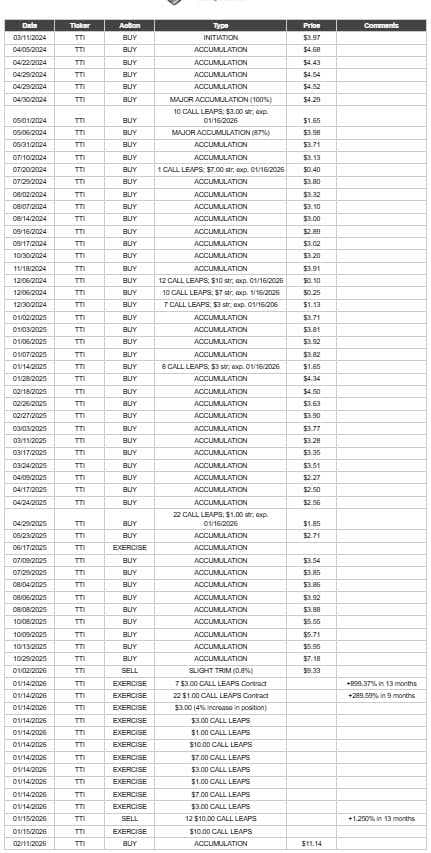
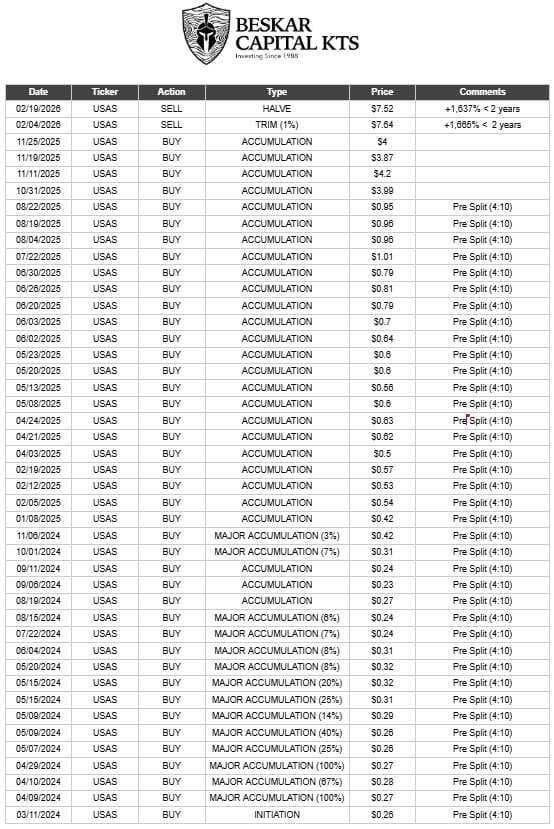
Originally published on Blossom on April 13th, 2024 Please find retrospective commentary at the end. The purpose of this series is to convey the decades of knowledge I have obtained from the truly greatest investors of all-TIME (and it’s not limited to the 2nd tier “greatest” ones that get all the press and re-quotes) to demonstrate HOW TO READ AND TIME THE MARKETS with profitable actions to sustain annualized double-digit returns. We do this by developing our toolbox to handle different market conditions using both tools from Fundamental and Technical analysis in combination of watching the activity of the INSIDERS, realizing we can’t beat ALL of them, but we can beat MOST of them and SQUASH our fellow INVESTORS. But we are certain to exclude the 75% of Conventionalist guidance - which is distributed to the masses of retail investors. These are the ones that talk incessantly about DRIP, DCA, dilutive S&P 500 investment vehicles, bonds, and returns on cash holdings, on and on. Makes me nauseous. 🤮 Young investors willing to take the TIME to learn about how to make their savings work for them aren’t a good match for this lazy investor product suite listed above! Always remember, Conventionalist advice is delivered to the general investing public. And most all of the general investing public is relatively poor. Conversely, the wealthy do something different. So why on Earth would we follow the advice that puts us on a path of “Conventional Wisdom”? You know what they all have in common? The same All-TIME returns. Check it out for yourself. Every TIME you see those acronyms and hear those cute sayings in a post (DCA, DRIP, “Buy Low, Sell High”, “Buy when there’s blood on the streets”, etc.), test it out, and click on the author’s all-TIME returns. If it’s ~7% +/- 2.5%, mark it down as “Conventionalist”. It is really amazing how that regurgitated advice plays through into all of their portfolio returns. Anyway, if it isn’t double-digit, annualized returns, then maybe you should look elsewhere. Just know that Wall Street wants you to be a Conventionalist (prey). OK. Got that out. Now, let’s add a new tool as we make more progress on our ability to read and TIME markets. As you know, I am a proponent of knowing where you are in the cycle. There are many cycles in play at any given TIME. Examples include: seasonal, business, product, real estate/banking crisis, super cycles, etc. Different sectors, subsectors, stocks, bonds, ETFs, etc. work best in different phases of any given cycle. There can be overlap, intersection, coincidence, and separation in cycles. Sounds like a lot to keep track of? Not really – because we follow the Wall Street playbook and their subsequent activity to position appropriately. But it’s enough that we can’t tackle in just one post. If you go back and re-read my post, “They are telling us so what are you waiting for?”, you know that I’m positioned for where we are in the real estate/banking crisis cycle. They date back to the early 1800’s when the stock markets got their start. Like clockwork, they start and expire on TIME. The 20-Year Chart is perhaps the most neglected chart of them all. And if you really claim to be a long-term investor, it should be referenced more frequently, if not the most. For companies that have a 20-year history, this chart can give incredible insight in to what we can similarly expect in price movements today at this point in the cycle. Why does this generally work? It requires an understanding of cycle duration and when they begin. We will get to that in this series. But for now, why not pull up the 20-year chart for all of your stocks that have a 20-year history and start thinking about how and why this gives us some insight with the TIMEframes I’ve laid out in previous posts. We’ll explain more in later posts. Try this exercise before we get into that. Note: A quick observation on the markets from the past 2 days. Large price drops in a short period of TIME is an EXTREMELY BULLISH indicator for a long runway for this bull market to run up into 2026, as we expect from the cycle. Expect the dips to be short-lived in these healthy pullbacks. Also, I shared 30 tickers of stocks in KTS #14 that I am currently watching (due to Wall Street’s favored sectors, subsectors) that Wall Street is currently accumulating. One example, $USAS , the wolves came in the last 10 minutes to close above the open for one of the few stocks up on the day. We love to buy these stocks because we know that Wall Street can’t risk NOT accumulating a stock with high conviction. I read and TIME these movements for extreme profits. Retrospective commentary - October 5th 2026 Still one of the most underappreciated charts, even among the best investors! When you think of Beskar Capital, you think of: $USAS – up about +415% since the original publication. $TGB – up about +224% since the original publication. $FTI – up about +183% since the original publication. $HL – up about +192% since the original publication. $TTI – up about +62.5% since the original publication. Look at all their charts. Put yourself in April 2024 and try to see how we were able to zoom out and get in at optimal points in TIME. The KTS series aims to help you recognize cycles and build the tools to identify money flows, accumulation, long-term breakouts, and get in before the conventionalists even know these tickers exist. This has been our credo since the beginning, and now it’s TIME to show the results and acknowledge the value of it all. If you read the KTS #13 re-post, you saw our transaction history on $TGB . You can see how we were able to accumulate with conviction. I compiled the same transaction history for $USAS , $TTI and $HL that were publicly disclosed before opening the website in February 2026. You can find all tables attached to this post. And you can see the links to each trade in the comment section below! 🏆 Open your favorite charting platform and identify our points of accumulation on the charts. Look at the charts and look at the dates when we built our positions. When you zoom out, you can see how effective the KTS tools can be. We witnessed $HL break out to highs not seen since the ’80s, $TGB break out to 35+ year highs, and on and on. If you can’t see how the tools I’ve developed over the past 36+ years can help you outperform the markets and generate amazing double-digit annualized returns… then I guess you can’t be helped at all. Beskar Capital cannot stress this enough: zoom out and recognize that you can learn to identify and profit from these long-term cycles. I always give you my best! 🏆 This is the Way! 🏄🌊
I found your KTS very late, but thankfully got in just in TIME to join the website. Very grateful for your help and teaching! 😁🌊🏄♂️
Luis
@luiyo · 1h
No disrespect but, good God that's a lot of words and a lot of links. I had to stop reading after the "nauseous" part.. 😨 Nowadays people's attention span don't last that long so maybe summarize it next time? I'm sure it's great knowledge but confusing af.
See the full comment section 👀Sign up for the full Blossom experience!