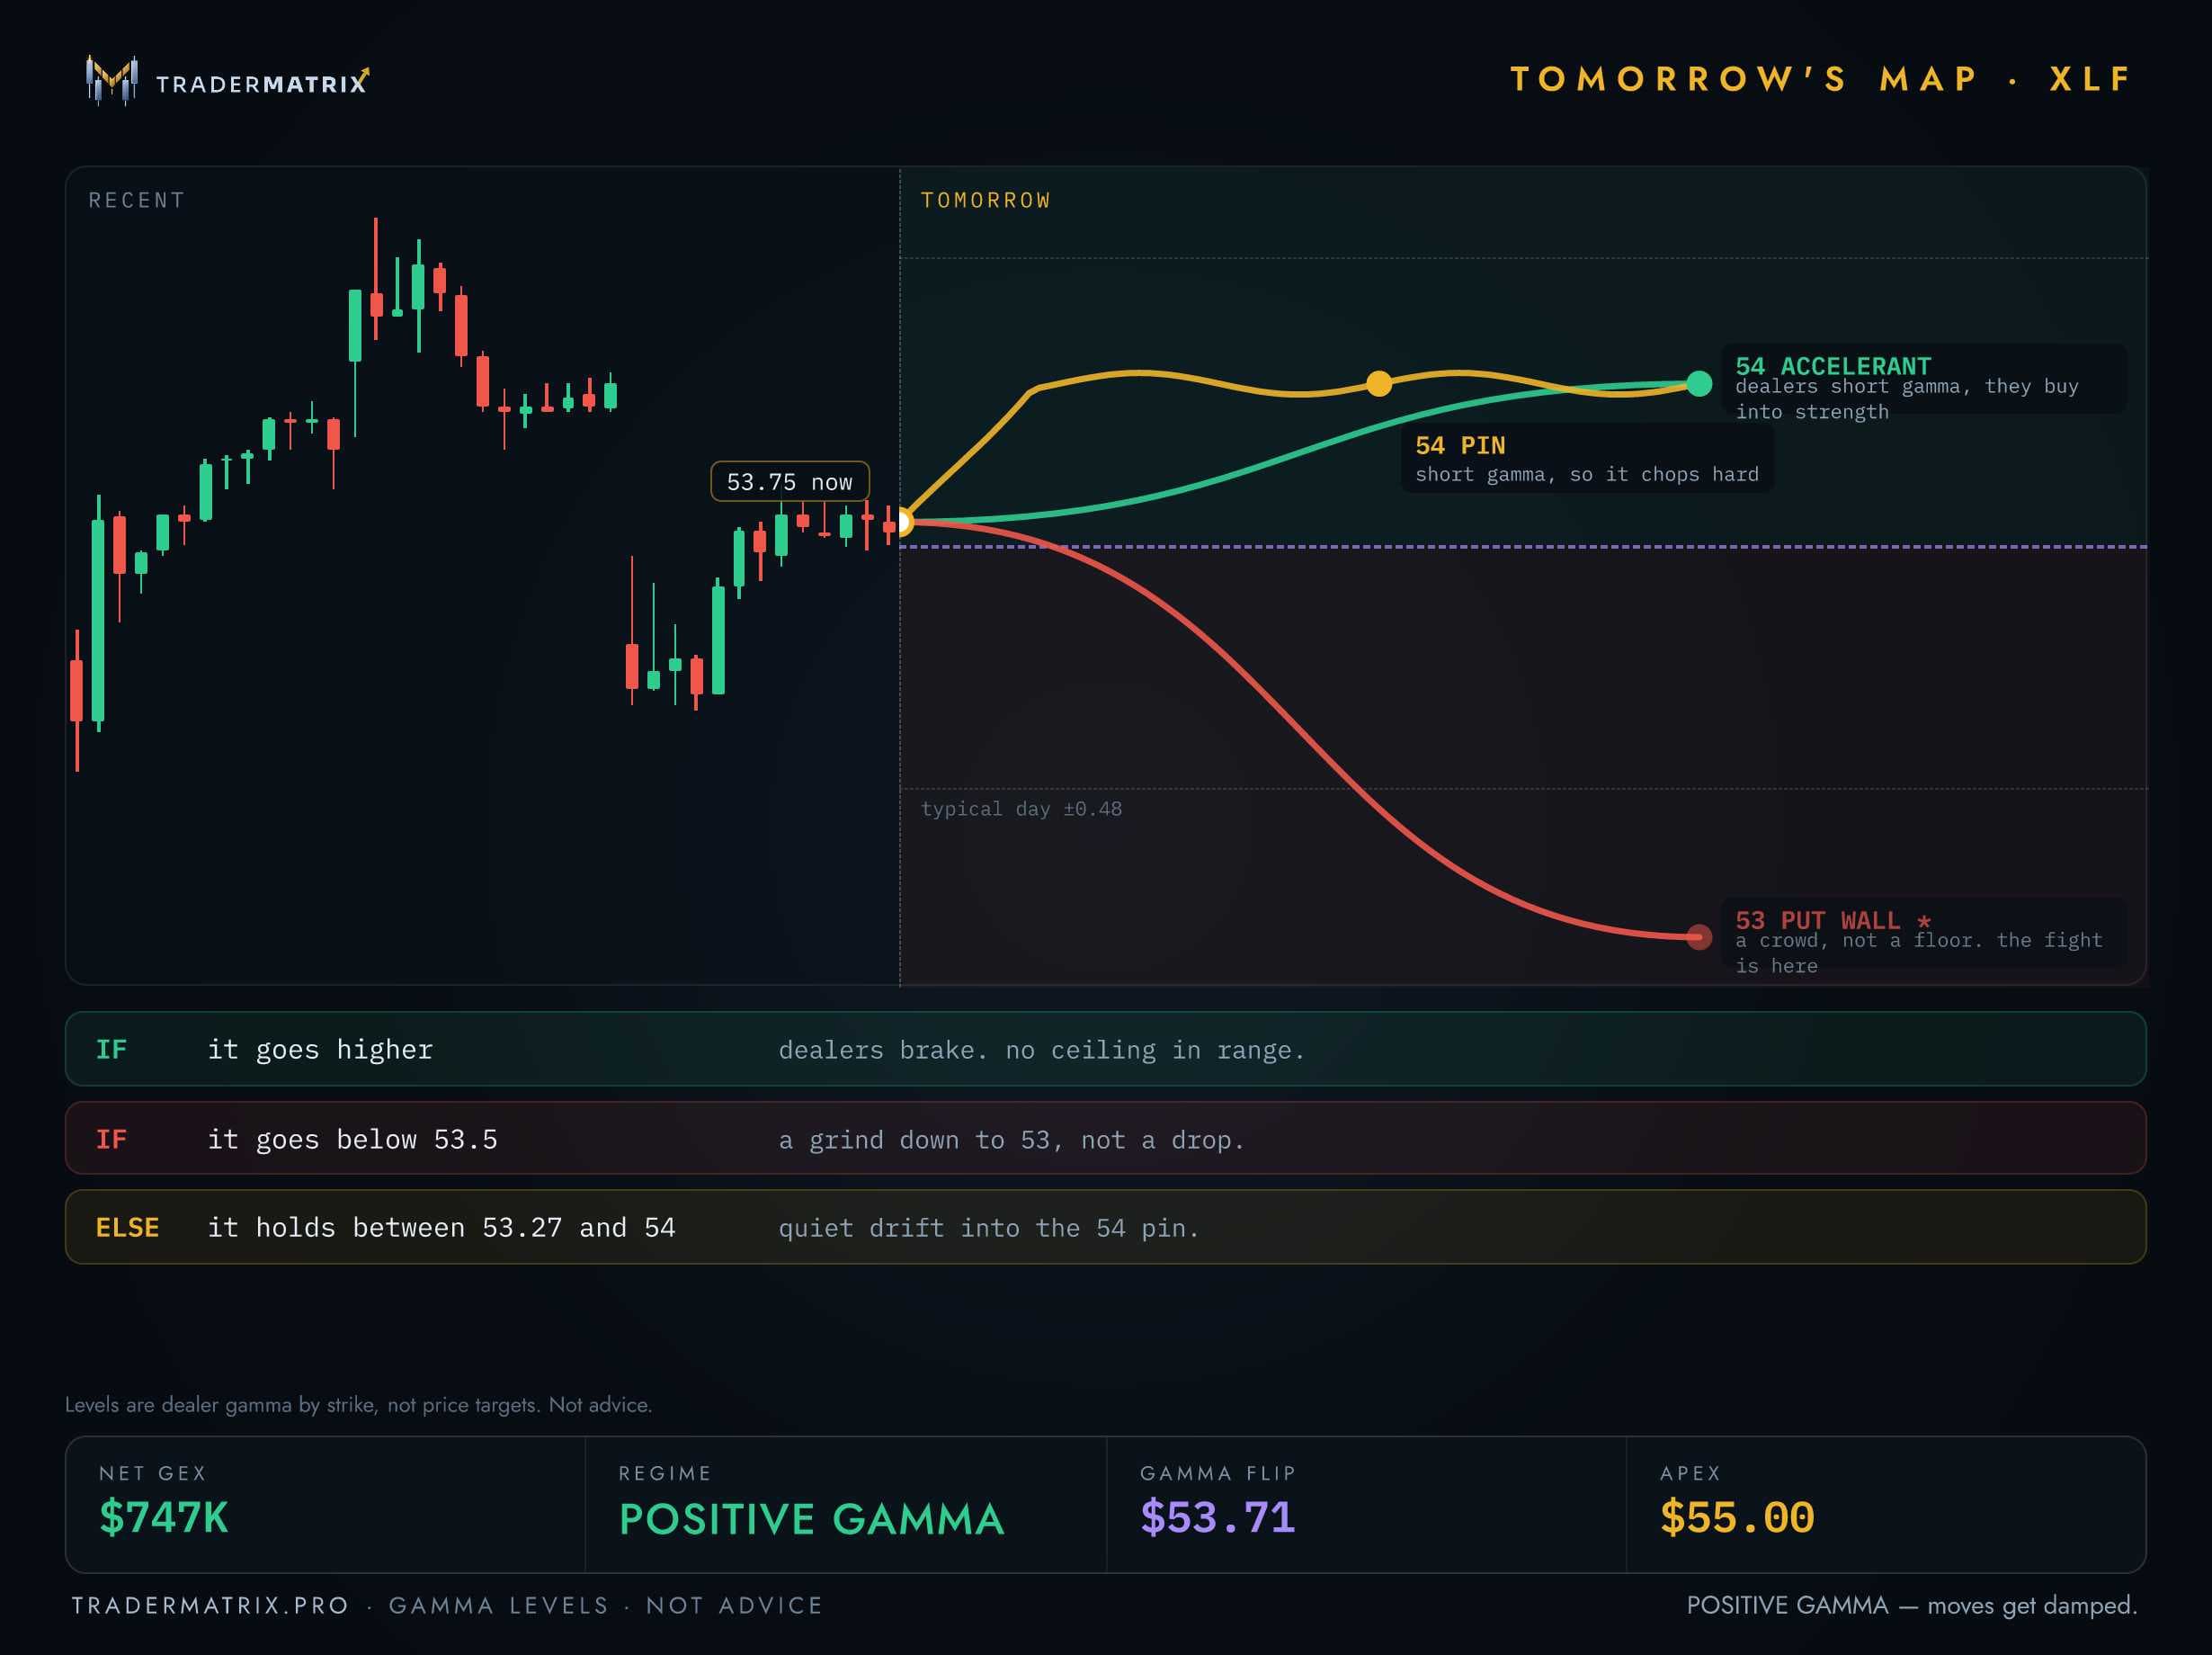
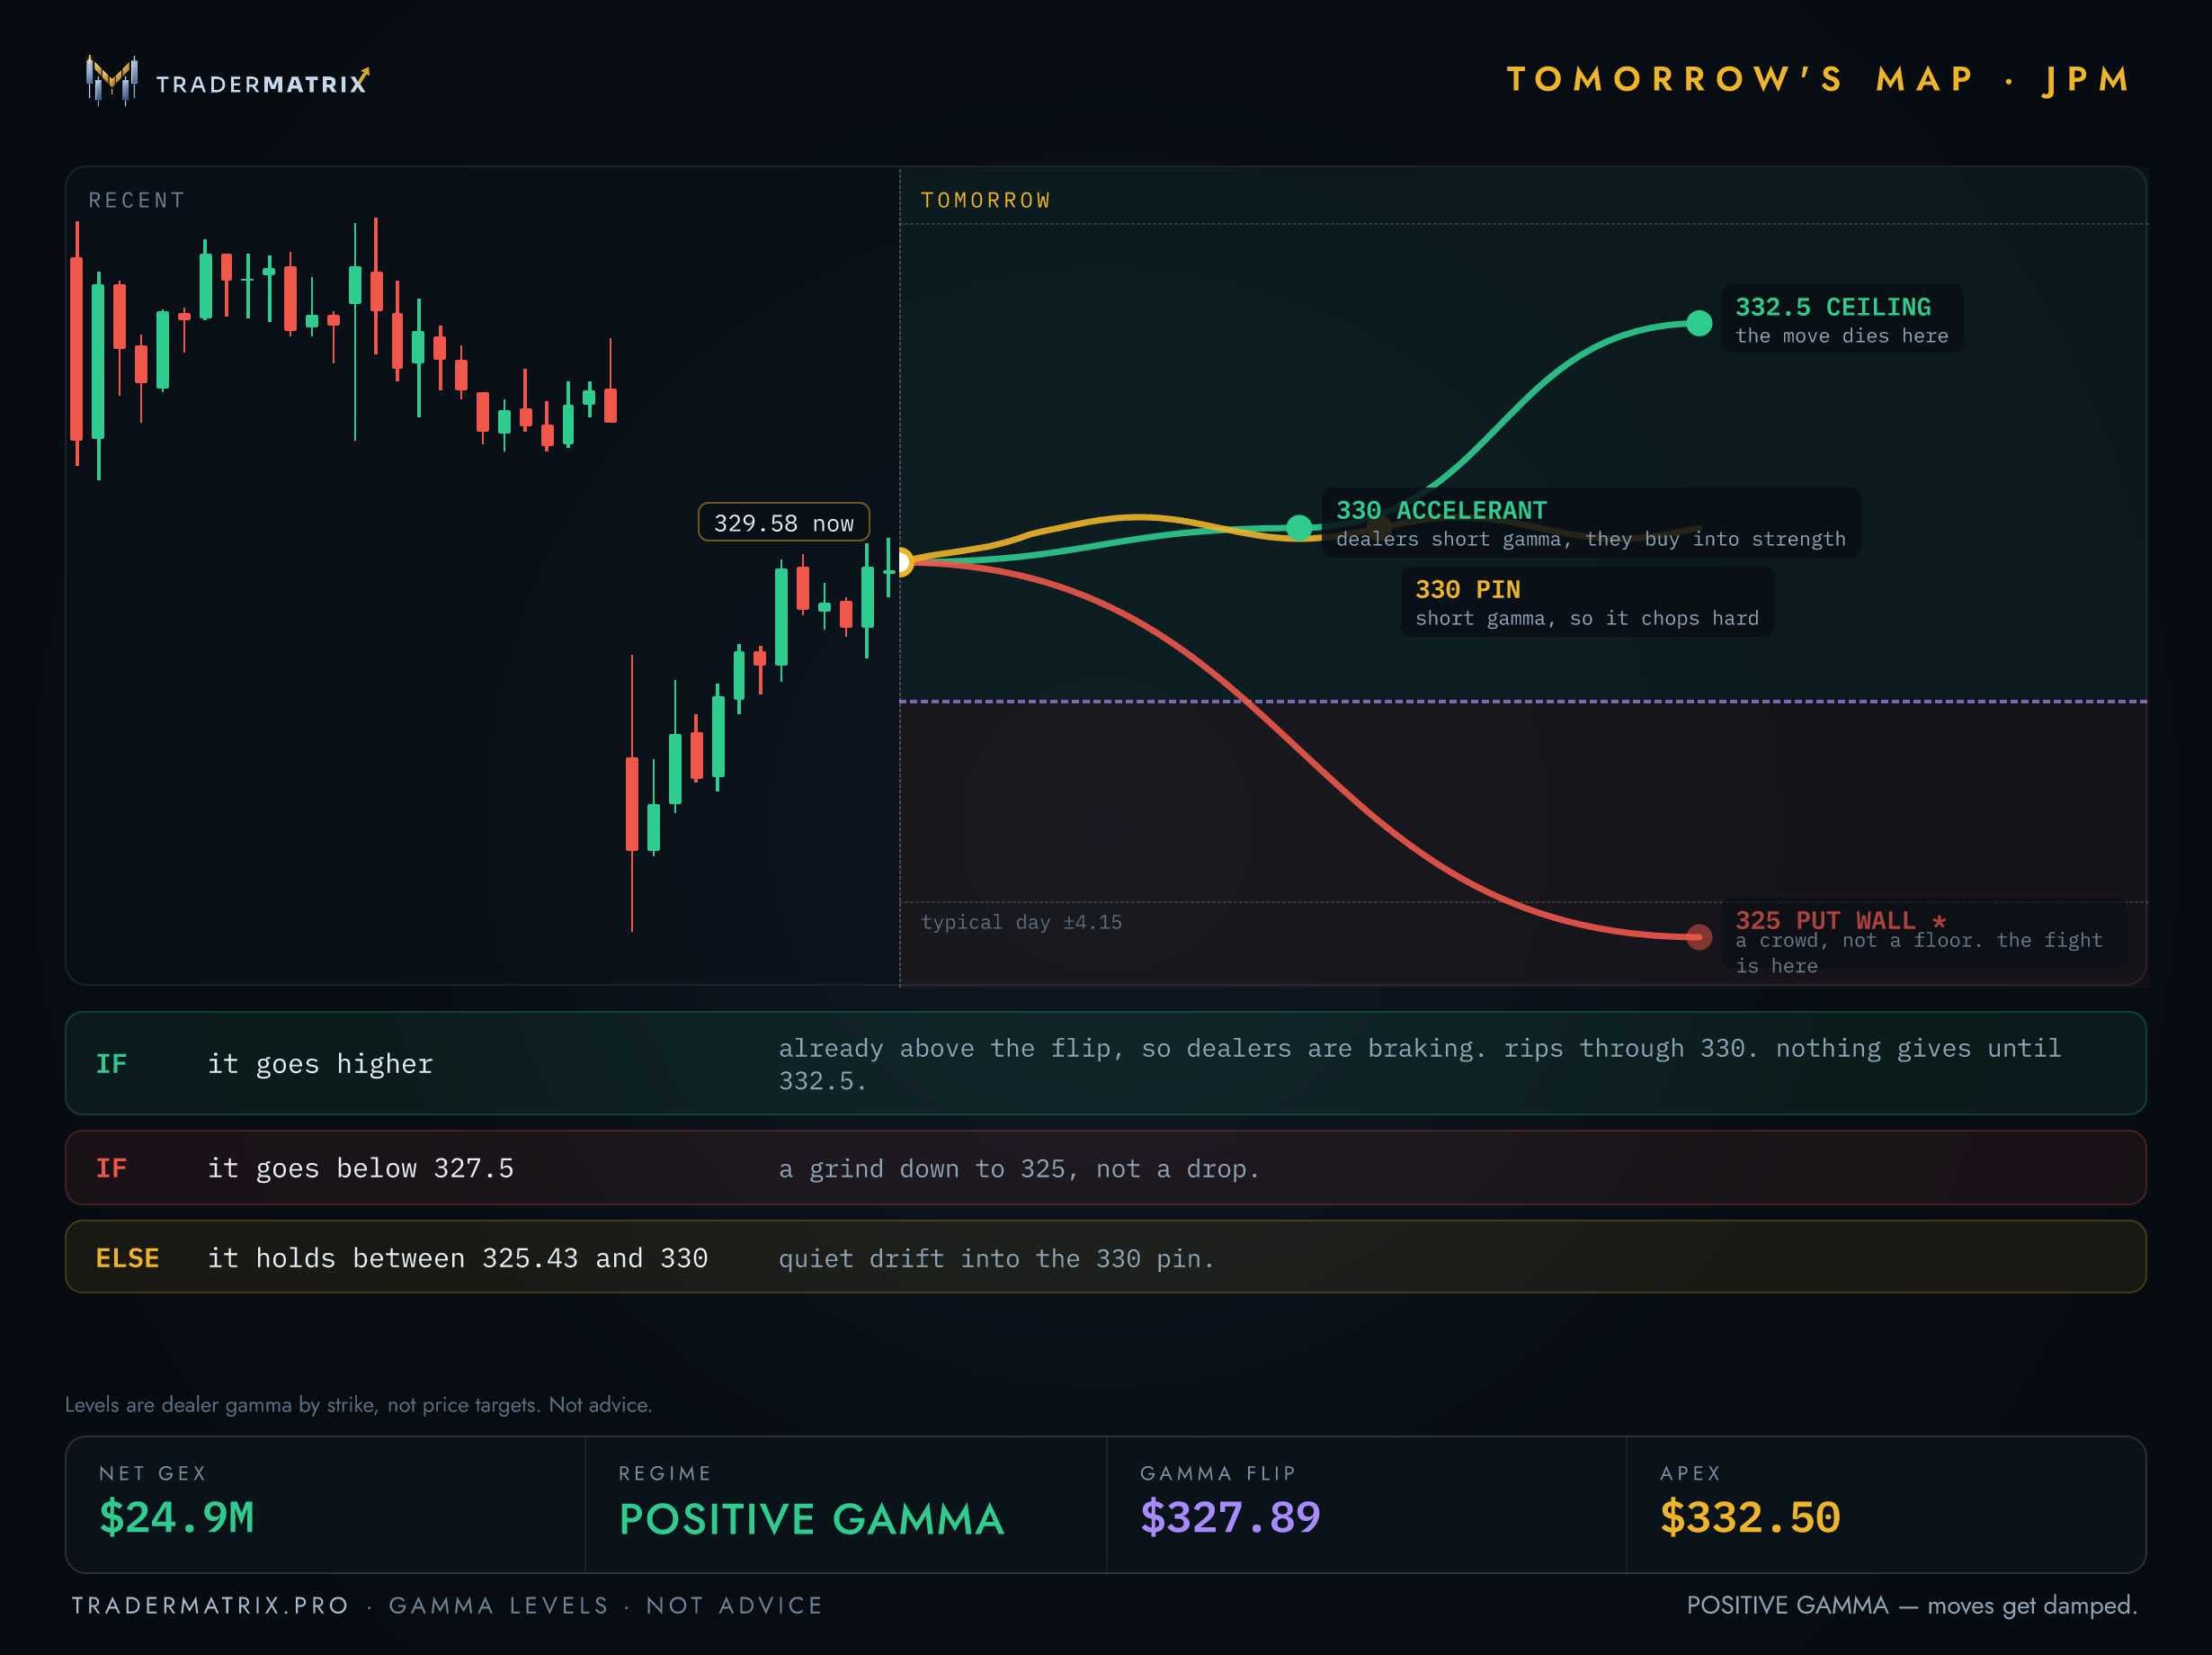
I think financials are starting to bottom. Not bottomed. Starting to. Quick RSI guide, because the rest of this uses it RSI is a score from 0 to 100. It shows how hard something has been getting bought or sold. - Over 70: overbought. Ran too hot, stretched. - Around 40 to 60: the middle. Nothing stretched. - Under 30: oversold. Sold too hard, a bounce gets likely. - Under 20: rare. Usually panic. And you read it on three charts, big to small: - Weekly: the big trend. Slow, matters most. - Daily: the swing in the middle. - Hourly: just timing. Fast and noisy. Bottoms usually line up in that order. Weekly cools off, daily gets washed out, hourly stops falling first, then price follows. $XLF right now, big to small - Weekly: was in the high 60s in late summer, almost hot. Now mid 40s. All the heat is out. Not oversold, but not stretched anymore either. - Daily: fell into the mid 20s around the start of October and sat under 30 for days. That is where the price made its low, around $53. Now back in the low 30s and holding there. - Hourly: today it dipped early, got bought, and closed near the top of its day. The selling just stopped pushing. Smallest signal, but it is the right order. Why banks, in plain words Rates went up too fast, and banks felt it first. Borrowing slowed, mortgages got too expensive, and the old bonds banks hold lost value. If rates calm down, banks are one of the first groups you would expect to stop falling. Today they did not fall. $XLF was down a little, but it never went back to last week's low, even with rates spiking again. A week ago, today would have made a new low. The big names held it up. $JPM fell under its 200 day line, around $328, this morning, and buyers pulled it back above by the close. $V was up a bit, like always in this selloff. $BRK.B was flat. The selling was in the smaller banks, and I am not dressing that up. Big names holding first is how bottoms start, but the rest still have to catch up. The money, from TraderMatrix - Financial stocks took in more options money than almost any other sector today, third best of eleven. For every $1 bet down, close to $3 was bet up. - $JPM: all of its flow was calls, close to $1M. One bigger bet needs it back in the mid $340s by next week, right after earnings. - $XLF itself: only a few tiny put bets. No size. The money likes the big banks more than the fund. - Dark pools, the big private trades, went the other way on JPM. The app read them as selling, but the app guesses on that, it says so itself. And the stock still closed fine. - No dark pool trades at all in $XLF. Nothing hidden either way. The dealer map, charts below - $55: the biggest dealer level, above price. Levels like that pull price up. That is the target. - $54: a pin, a level price gets stuck on. - $53: a crowd of put bets. The map calls it a crowd, not a floor, and says the fight is here. Same spot as last week's low. - The flip line sits right at the price. We are on it. - Honest part: the app argues with itself. The chart says dealers calm moves, another page says they speed them up. I trust the levels, and the levels agree. $53, $54, $55. The top names have cleaner maps. JPM's big level sits just above it, around $330 to $332. $V's is up at $380 with a strong floor at $370. Both Apex charts are under this post, $XLF first, then $JPM. Rates, still the main thing The 10-year hit about 5.36% this morning, highest since 2002. Then buyers showed up in force at the government bond sale and it backed off to about 5.28%. My line for this idea is still 5%, we are not close. But buyers pushing back is new. What I need to see - Thursday's bond sale: buyers show up again. - $XLF through the $54 pin and a close over $55. - $JPM keeps holding the line it defended today. - October 13 earnings: not the headline number. Do they guide lending income up or down, and are bad loans getting worse. What kills it - $XLF under last week's low, around $53, and staying there. - $JPM loses its line for real. - Rates close above about 5.3%. Close, not a morning spike. Today spiked and could not hold it. That is the stack. Weekly cooled, daily washed out, hourly stopped pushing, biggest bank defended its line, money is betting up into earnings, and the dealers' biggest level sits overhead at $55. Against it: small banks still weak, the fund's own flow was nothing, and my app cannot agree with itself. Not proof of a bottom. Bottoms never come with proof. They come with a stack like this, and then price either follows or it does not. The maps and flow in this post come from TraderMatrix Pro, the main tool I pay for. My link: https://www.tradermatrix.pro/?ref=FZ9MX6FC. Full disclosure, it is an affiliate link and I earn a commission if you sign up. No fake discount. Just the tool on my screen every day. Are you seeing a bottom forming in financials, or is this just a pause before the next leg down? Not financial advice
188 views
0 Comments
No comments available.
Join the conversation with 500,000+ other investors 💸
Create an account to get access to everything Blossom has to offer!
📊 Personalized algorithm based on your investing style, experience level and interests
📈 Powerful portfolio and dividend tracking tools
👀 See what top creators and others in the community are investing in