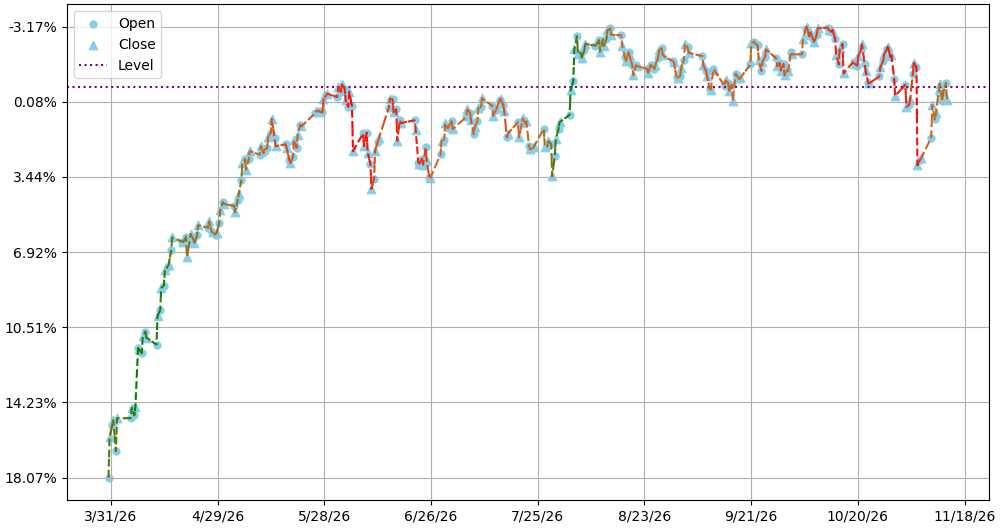
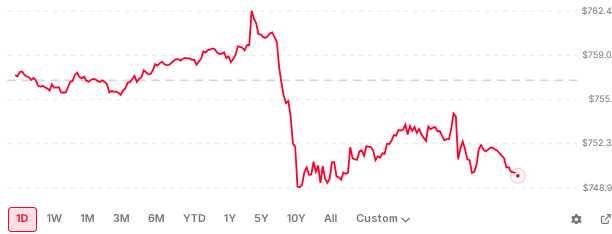
In the first chart, $SPY looks like it has now retested that purple level, formed an M-top at it and become set to fall like it did after testing that level back in early June. (Forsooth, after-hours trading already appears - in the second chart - to be consistent with this!) 😑
10 views
0 Comments
No comments available.
Join the conversation with 500,000+ other investors 💸
Create an account to get access to everything Blossom has to offer!
📊 Personalized algorithm based on your investing style, experience level and interests
📈 Powerful portfolio and dividend tracking tools
👀 See what top creators and others in the community are investing in